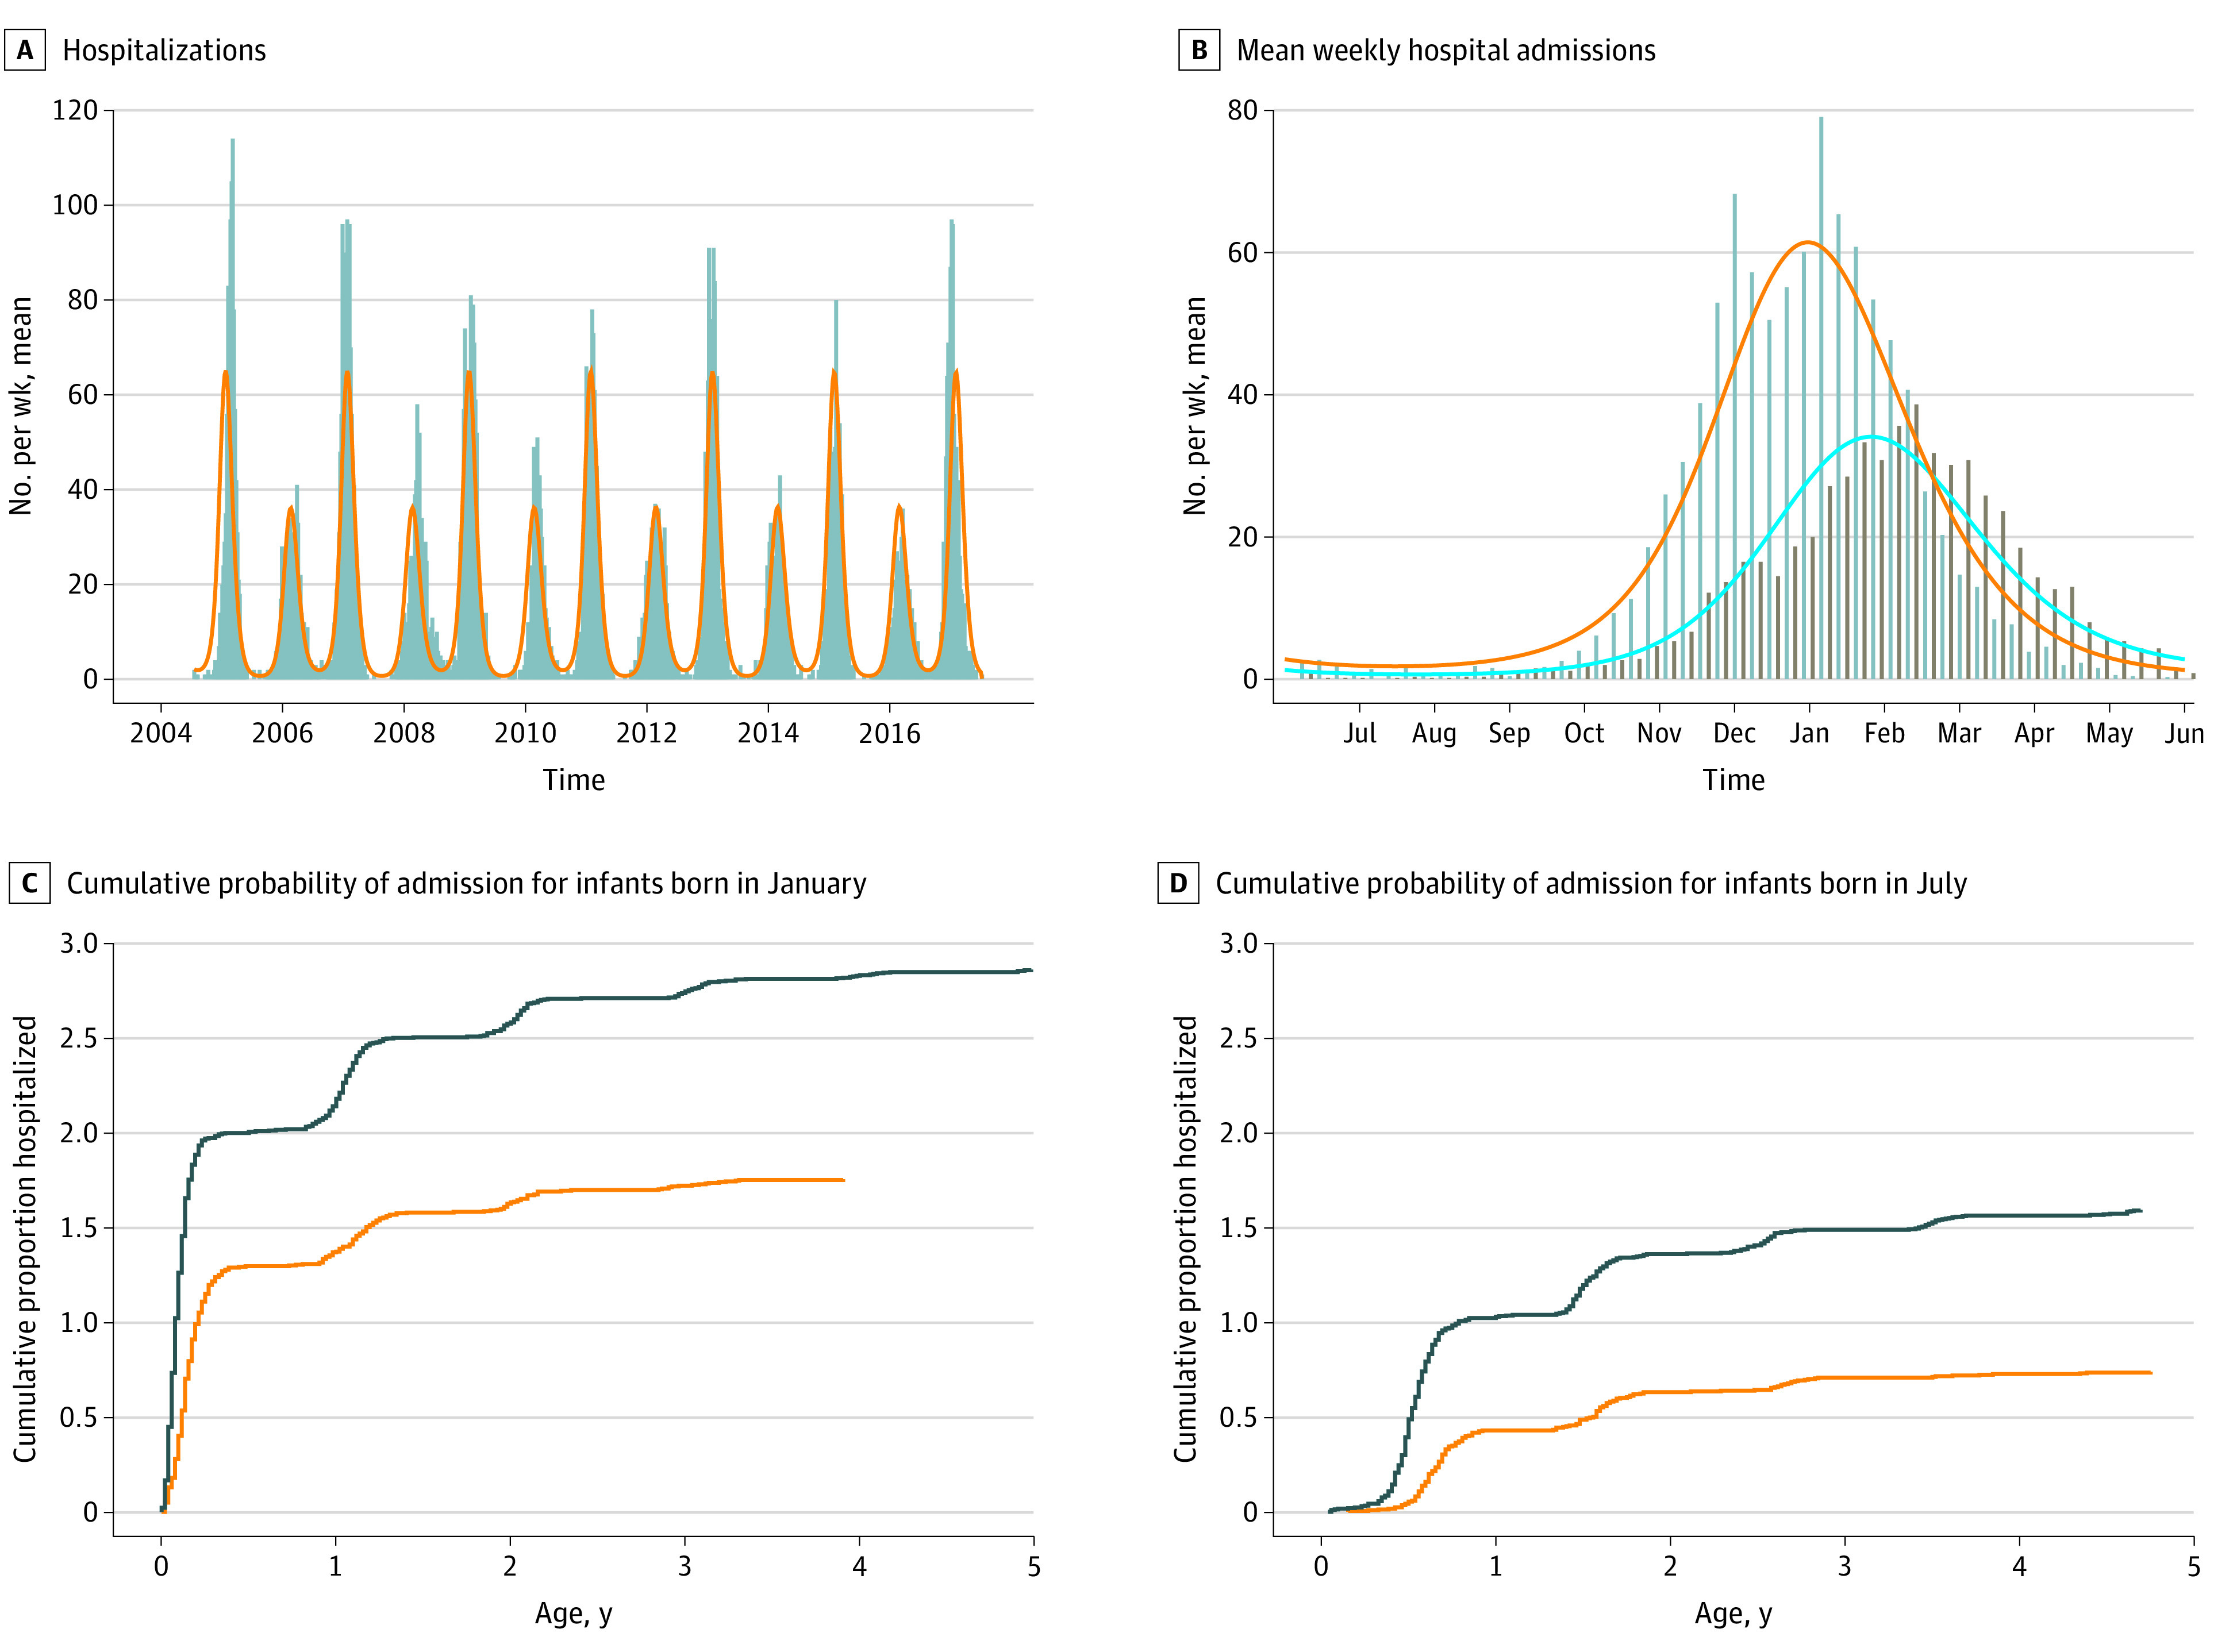
Figure 3. Hospitalizations for Respiratory Syncytial Virus (RSV) in Alberta, Canada, 2004-2017.

A, Weekly hospitalizations (gray bars) and fitted mathematical model (orange line) show biennial pattern. B, Mean weekly admissions in even respiratory virus seasons (gray bars, orange line) show higher and earlier peak, compared with odd seasons (brown bars, blue line), coinciding with laboratory-based data (Figure 2A). C, Cumulative probability of admission for infants born in January of even (black line) and odd (orange line) seasons. Early infancy during the RSV season was associated with high admission rates in the first months of life, with plateau during the first summer of life and another wave of cases in subsequent winters. Infants born in January of even seasons had a higher hazard of admission over the first 5 years of life. D, Cumulative probability of admission for infants born in July of even (black line) and odd (orange line) seasons. Born in a summer month, the rate of hospitalization was lower in early infancy, with waves of admissions during the first and subsequent winters. Overall, fewer July-born infants were hospitalized with RSV before their fifth birthday than January-born infants, and the risk of hospitalization was lower among infants born in odd seasons.
