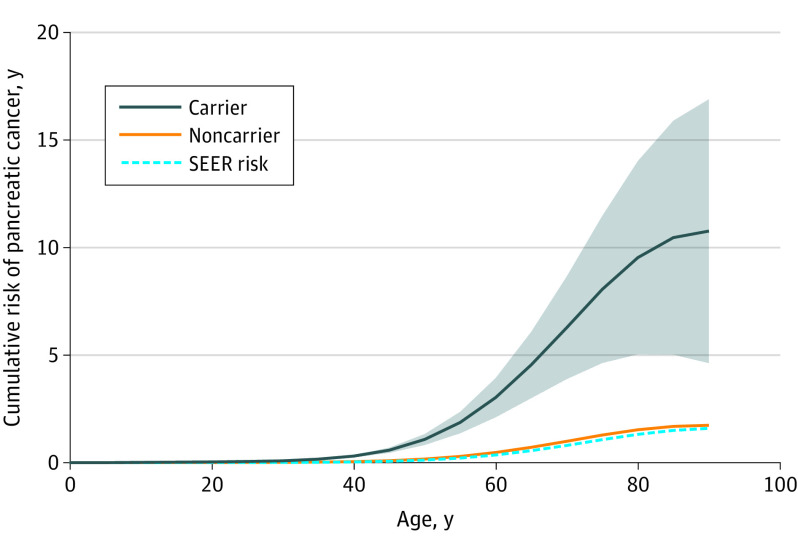
Figure. Cumulative Risk of Developing Pancreatic Cancer, by ATM Pathogenic Variant Status.
The shaded area shows the 95% CIs and the dashed blue line denotes the risk from 2000 to 2017 based on data from SEER, the Surveillance, Epidemiology, and End Results Program (Surveillance Research Program, National Cancer Institute; https://seer.cancer.gov/).

