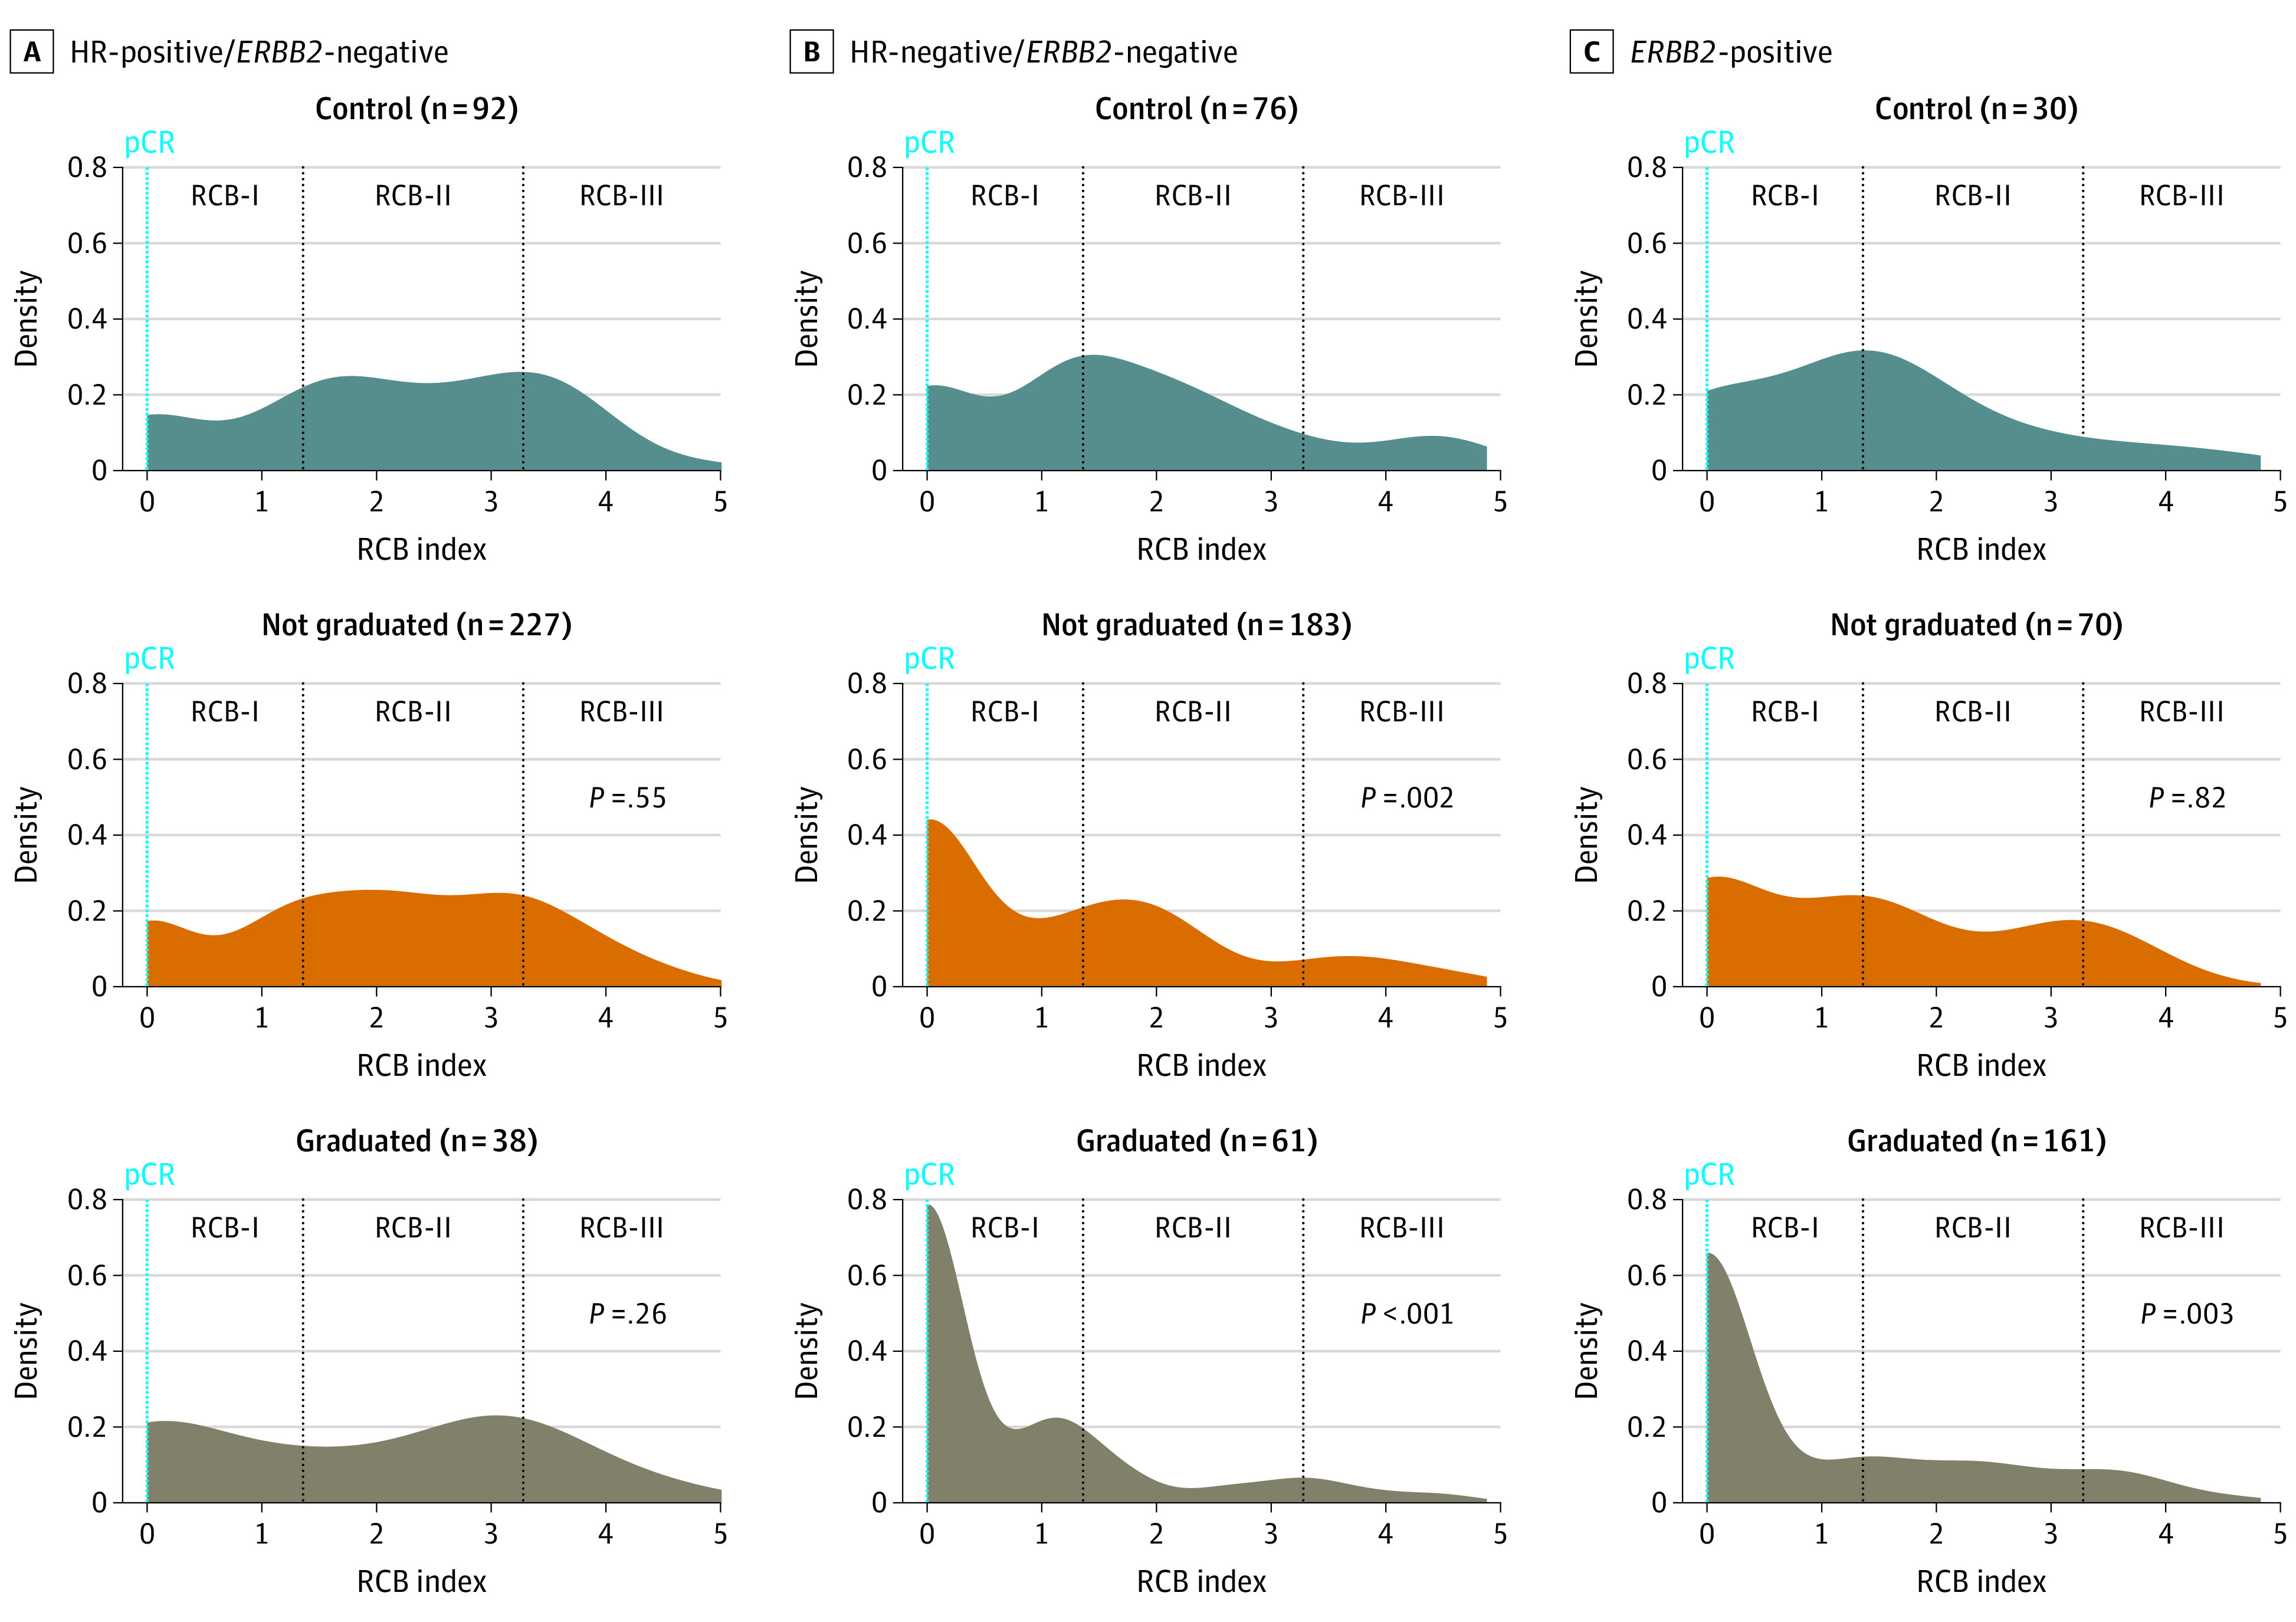
Figure 4. Landscape Plots of the Distribution of Residual Cancer Burden (RCB) in 3 Categories of Treatments From I-SPY2 Within Hormone Receptor (HR)–Positive/ERBB2-Negative, HR-Negative/ERBB2-Negative, and ERBB2-Positive Subtypes.

P values describe the Wilcoxon rank sum analysis of each experimental treatment group compared with the control group for that subtype; pCR indicates pathologic complete response.
