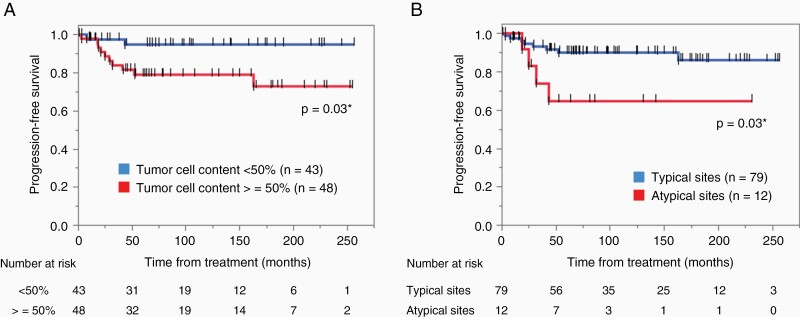
Figure 3.
Kaplan–Meier curves were generated for progression-free survival (PFS) analyses. (A) Cases with high tumor cell content (≥50%, n = 48) showed shorter PFS than cases with low tumor cell content (<50%, n = 43) (P = .03). (B) Cases with lesions at atypical sites (n = 12) showed shorter PFS than cases with lesions at typical sites (n = 79) (P = .03). *P < 0.05.

