FIGURE 9.

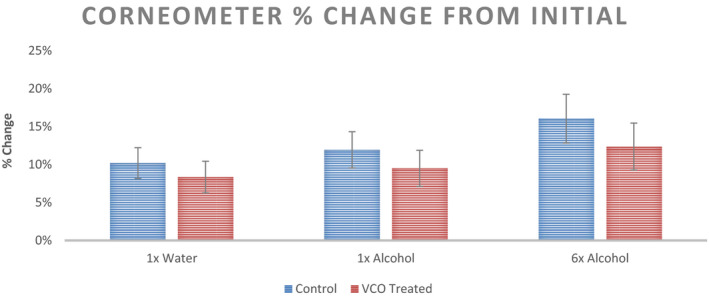
Percent change from initial readings in Corneometer values recorded at three sites with different stimuli for the untreated control and VCO pre‐treatment (n = 12, mean ± SE)

Percent change from initial readings in Corneometer values recorded at three sites with different stimuli for the untreated control and VCO pre‐treatment (n = 12, mean ± SE)