
FIGURE 10.
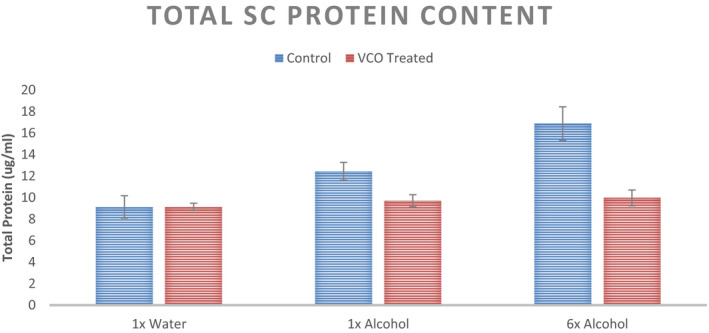
SC Protein Content from the tape strip of the mid volar forearm at three sites with different stimuli for the untreated control and VCO pre‐treatment (n = 12, mean ± SE)
Official websites use .gov
A
.gov website belongs to an official
government organization in the United States.
Secure .gov websites use HTTPS
A lock (
) or https:// means you've safely
connected to the .gov website. Share sensitive
information only on official, secure websites.
SC Protein Content from the tape strip of the mid volar forearm at three sites with different stimuli for the untreated control and VCO pre‐treatment (n = 12, mean ± SE)