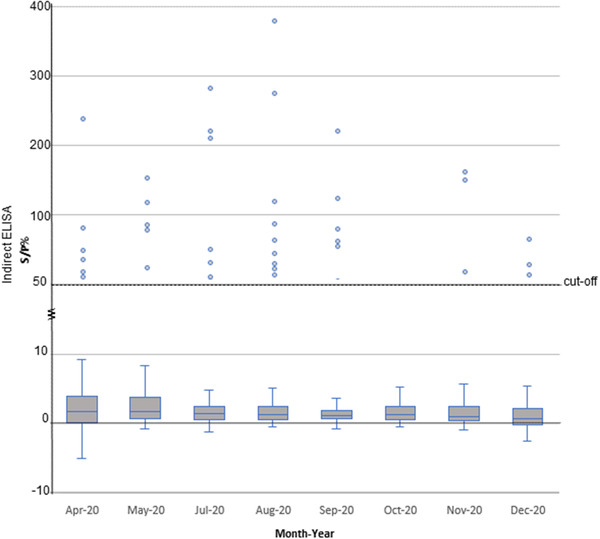
FIGURE 2.

Graph depicting %S/P of indirect ELISA results. Dots represent positive samples by indirect ELISA (S/P% > 60%). Bar charts represent %SP with standard deviations. For the cut‐off values, S/P% > 60% is positive, S/P% 50−60% is suspect and < 50% is negative
