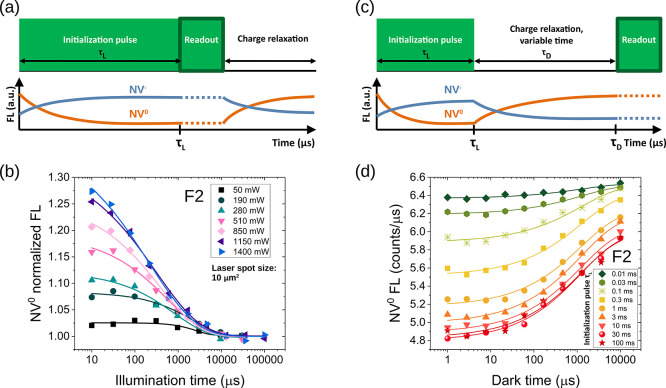
Figure 3.
Detection of charge dynamics. (a) Pulse sequence adopted to investigate charge dynamics under laser pumping, for variable irradiation pulse length τL. Laser-induced NV0 → NV– photoconversion results in a decrease of the NV0 signal and an increase of the NV–. As an example, panel (b) shows the decrease in NV0 FL for sample F2, as measured in the 550–600 nm window, for different laser powers. (c) Pulse sequence used to detect the charge recovery in the dark after a preparation pulse. Recovery of NV0 FL for sample F2 at a laser power of 625 mW is shown in panel (d). Various curves in panel (d) correspond to different durations of the initialization pulse.

