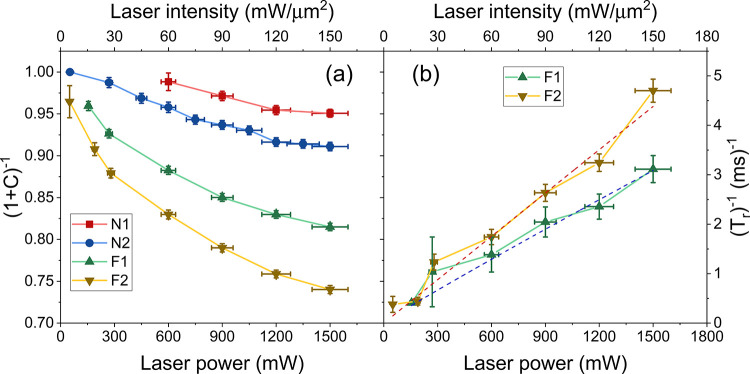
Figure 4.
Parameters describing NV0 → NV– photoconversion under laser irradiation. The quantity (1 + C)−1 in (a) indicates the ratio between the equilibrium value of FL and the initial value, right after the initialization pulse. The decrement is more consistent for the flat samples (down to 75% for sample F2). The photoconversion rate (Tr)−1 displayed in (b) is nearly linear with laser power, following a power law with exponents of 0.95 ± 0.07 for F1 and 1 ± 0.07 for F2 (red and blue dashed curves).

