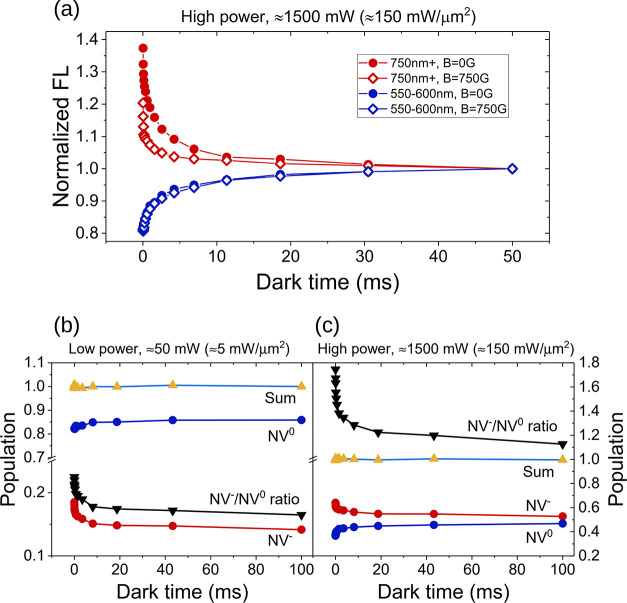
Figure 5.
Spin and charge dynamics after the laser pulse. The effect of a strong magnetic field (750 G) on the fluorescence of sample F2 at a laser power of 1500 mW is shown in (a). FL was collected in the 550–600 nm region (blue curves) and in the >750 nm window (red curves), with and without magnetic field (empty and solid symbols, respectively). When considering only the NV0 centers (550–600 nm window), no change in the FL profile is observed, irrespective of the magnetic field applied. On the contrary, the signal in the >750 nm window is reduced by a strong magnetic field. This difference is the result of quenching NV– spin polarization through spin state mixing. However, beyond ≈10 ms, the difference vanishes, and the evolution at longer times is dominated by charge dynamics. At low (b) and high (c) laser powers, the 10 ms laser pulse creates an excess of NV–s (red curve) that convert to NV0s (blue curve) in the dark. NV– and NV0 populations are normalized such that their sum is 1 (yellow-azure curve). The ratio R is indicated by the black curve. A near-equilibrium ratio (0.15) is reached after 100 ms at low power (50 mW), while a large and sustained R (1.13) value is observed after high power irradiation (1500 mW). Results of (b) and (c) are taken at a magnetic field of 750 G, which enables determining the charge state ratio (for more details, see the text or Section S4 of the Supporting Information).

