
FIGURE 2.
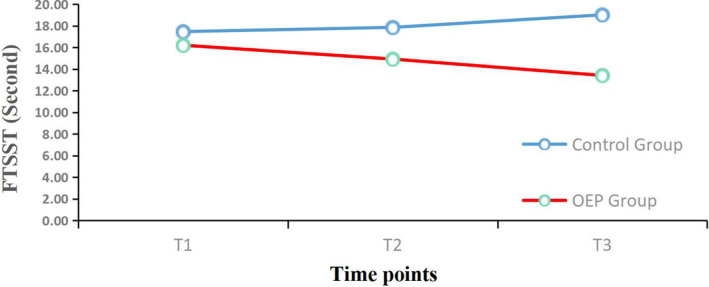
Mean changes from baseline for the Five Times Sit to Stand Test. (FTSST) over the 12‐week period. OEP: Otago exercise program; T1 = Before intervention; T2 = 6 weeks follow‐up; T3 = 12 weeks follow‐up
Official websites use .gov
A
.gov website belongs to an official
government organization in the United States.
Secure .gov websites use HTTPS
A lock (
) or https:// means you've safely
connected to the .gov website. Share sensitive
information only on official, secure websites.
Mean changes from baseline for the Five Times Sit to Stand Test. (FTSST) over the 12‐week period. OEP: Otago exercise program; T1 = Before intervention; T2 = 6 weeks follow‐up; T3 = 12 weeks follow‐up