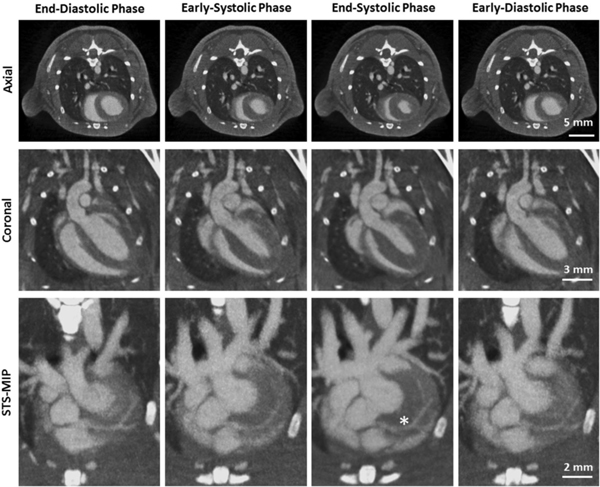
Fig. 2.
Phase-correlated reconstructions of a mouse showing different cardiac motion States (eolumns). The first row illustrates axial slices, the seeond row coronal slices, and the third row a sliding thin slab-maximum intensity projections (STS-M1P). The asterisk marks the first bifurcation of the left coronaiy artery. (C = 300HU, W = 1500HU). Figure reproduced from [24] without modification under the Creative Commous CC BY license.

