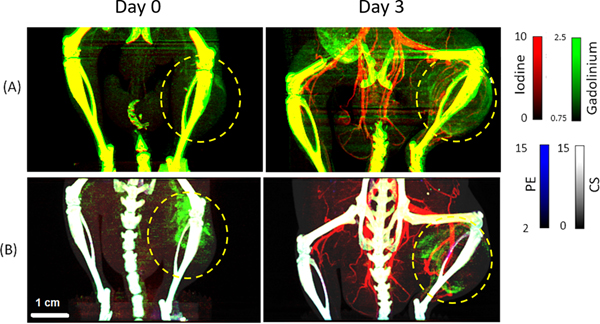
Fig. 5.
Application of in vivo DE EID CT (A) and PC CT (B) in delayed-phase imaging of a sarcoma tumor (yellow circles; maximum intensity projection images shown). At Day 0, 3 h after injection, liposomal gadolinium (green, mg/mL) has already begun to accumulate within the sarcoma tumor (yellow circles), allowing visualization and quantification of tumor vascular permeability. On Day 3, immediately after liposomal iodine injection (red, mg/mL), material decomposition can be used to correlate tumor vascular permeability (gadolinium signal) and tumor vascular density (iodine signal). These signais are indicative of tumor response to potential therapies. Additional spectral information provided by PC CT reduces background signal and improves separation of contrast materials from bone and soft tissues (photoelectric effect, PE map, blue; Compton scattering, CS map, gray) compared with DE EID CT. (For interpretation of the referenees to colour in this figure legend, the reader is referred to the web version of this article.)

