Fig. 6.
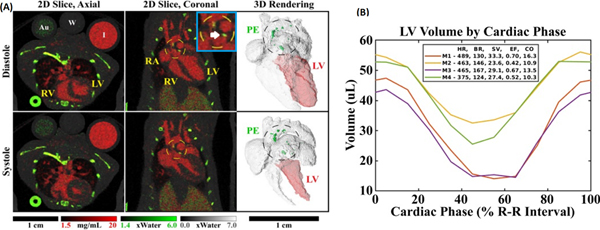
Photon-counting cardiac CT in the mouse. (A) Matching 2D slices are shown at diastole and systole in axial and coronal orientations. Complementary 3D renderings show the four chambers of the heart and the aortic arch, including a segmentation of the left ventricle (LV) used to derive cardiac functional metrics. Decomposition was performed into three basis materials: iodine (red), photoelectric effect (PE, green), and Compton scattering (gray). Calibration vials containing gold (Au, 5 mg/mL), water (W), and iodine (I, 12 mg/mL) can be seen in the axial slices. Calcified atherosclerotic plaques (white arrow) appear prominently within the PE map, near the aortic val ve and within the aortic arch, and are denoted by dashed circles. (B) Left ventricular volume curves are plotted along with a ta ble of the heart rate (HR, beats/min), breathing rate (BR, breaths/min), stroke volume (SV, μL), ejection fraction (EF), and cardiac output (CO, mL/min) for 4 mice (M#). (For interpretation of the references to colour in this figure legend, the reader is referred to the web version of this article.)

