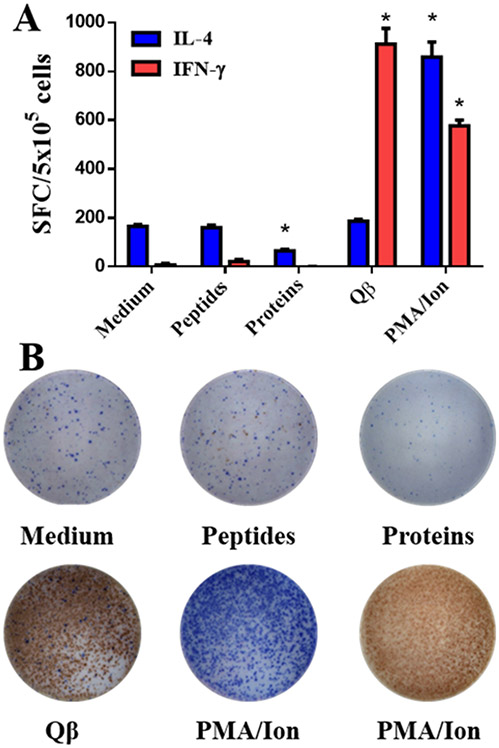
Figure 7.
T-cell activation using ELISpot assay and splenocytes from immunized mice. Splenocytes (5 x 10⁵ cells per well) from 3Ag s.c. immunized mice were stimulated with medium only (no stimulation control), a mixture of free-peptides (-ApoB, -CETP, and -PCSK9), a mixture of targeted proteins (ApoB, CETP, and PCSK9), unmodified Qβ VLP or PMA/Ionomycin (positive control). A) Cytokine (IFN-γ and IL-4) producing cells were counted as splenocytes forming colonies (SFC). B) Representative images of blue (IL-4) and red (IFN-γ) spots formed by stimulated splenocytes. Splenocytes from three mice (n= 3) were tested individually in triplicate. Data is shown as mean ±SD. All comparison between means of vaccinated and control group were done using unpaired t test (two-tailed, 95% confidence value). P values < 0.05 were considered as statistically significant. *= p<0.05 compared to medium.

