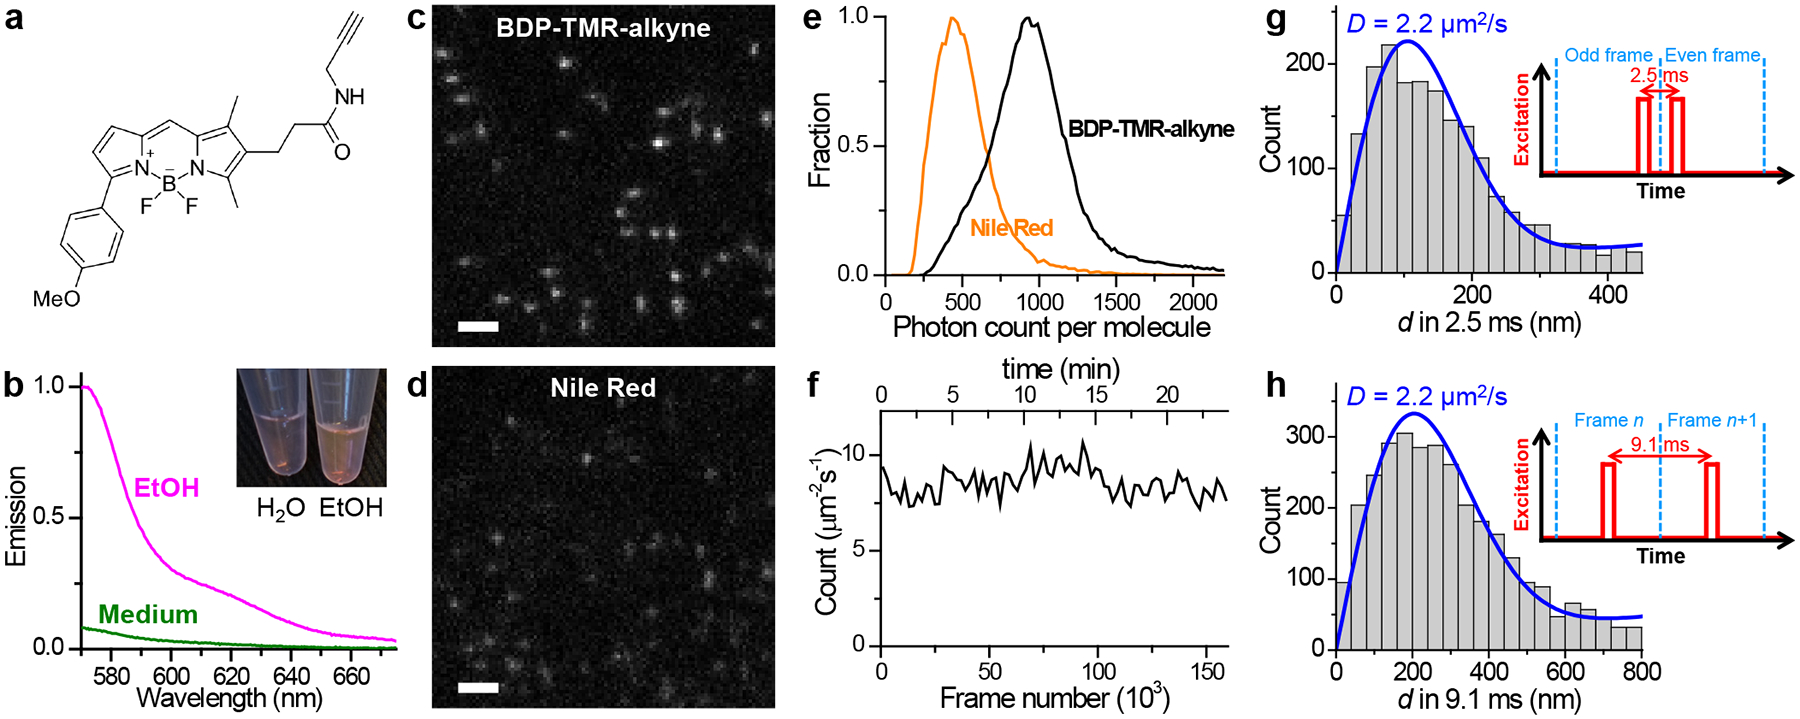
Figure 1.

BDP-TMR-alkyne for stroboscopic PAINT and SMdM of cellular membranes. (a) Chemical structure of BDP-TMR-alkyne. (b) Fluorescence emission spectra of 3.3 nM BDP-TMR-alkyne in the aqueous cell medium (green curve) vs. in ethanol (magenta curve), when excited at 560 nm. Inset: photo of 10 μM solutions of BDP-TMR-alkyne in water vs. in ethanol. (c,d) Typical single-molecule images of BDP-TMR-alkyne (c) vs. Nile Red (d) in cell membranes recorded under identical conditions with stroboscopic excitation pulses of τ = 1 ms duration. A cylindrical lens was applied to introduce image elongations in vertical or horizontal directions for molecules of different depths. (e) Distribution of single-molecule photon counts for the two cases. (f) Time-dependent count of the detected BDP-TMR-alkyne single molecules per μm2 per second at the plasma membrane of a COS-7 cell, showing no noticeable drop over 1.6×10⁵ frames (24 min at 110 fps). (g,h) Typical distributions of transient single-molecule displacement d of BDP-TMR-alkyne at the COS-7 cell plasma membrane under two stroboscopic excitation schemes (insets): repeated tandem excitation pulses at a Δt = 2.5 ms center-to-center separation (g), vs. excitation at the middle of every frame at 110 fps (Δt = 9.1 ms) (h). Blue curves: MLE (maximum likelihood estimation) fits to our model, with resultant diffusion coefficient D labeled. Scale bars: 2 μm (c,d).
