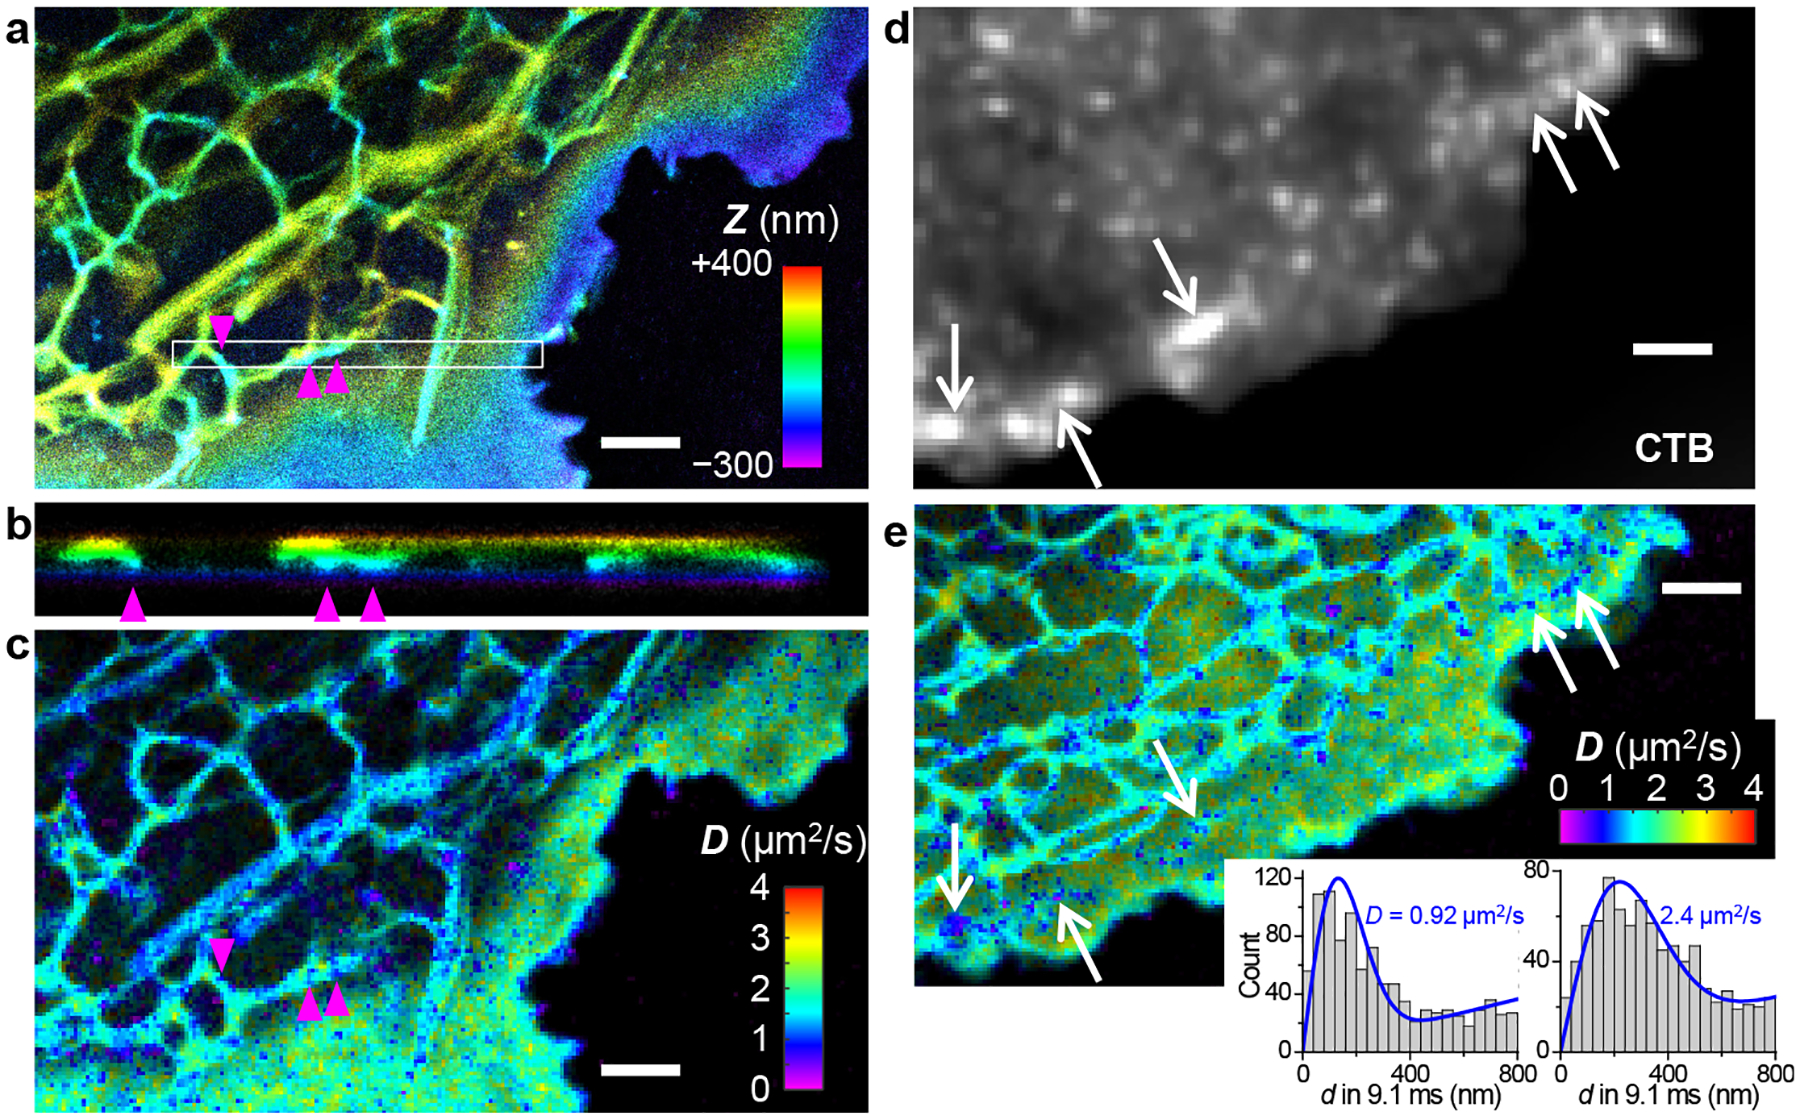
Figure 2.

Concurrent 3D-SMLM and SMdM diffusion mapping of cellular membranes through stroboscopic PAINT of BDP-TMR-alkyne. (a) 3D-SMLM image obtained in a live COS-7 cell. Color presents depth (z); purple/blue: closest to the coverslip; red/yellow: farthest away. (b) Cross-sectional view along the box in (a) in the xz direction. Arrowheads point to possible contacts between ER and the ventral plasma membrane. (c) SMdM diffusivity map constructed from the same single-molecule data. Color presents local diffusivity D. (d) Epifluorescence image of dye-tagged CTB applied to another COS-7 cell. (e) BDP-TMR-alkyne SMdM diffusivity map of the same cell. Insets: typical distributions of single-molecule displacements for the low-diffusivity nanodomains (left) versus other parts of the plasma membrane (right), and their MLE fits for D (blue curves). For both cells, stroboscopic excitation of τ = 1 ms duration was applied at the middle of every frame at 110 fps (Δt = 9.1 ms). Scale bars: 2 μm.
