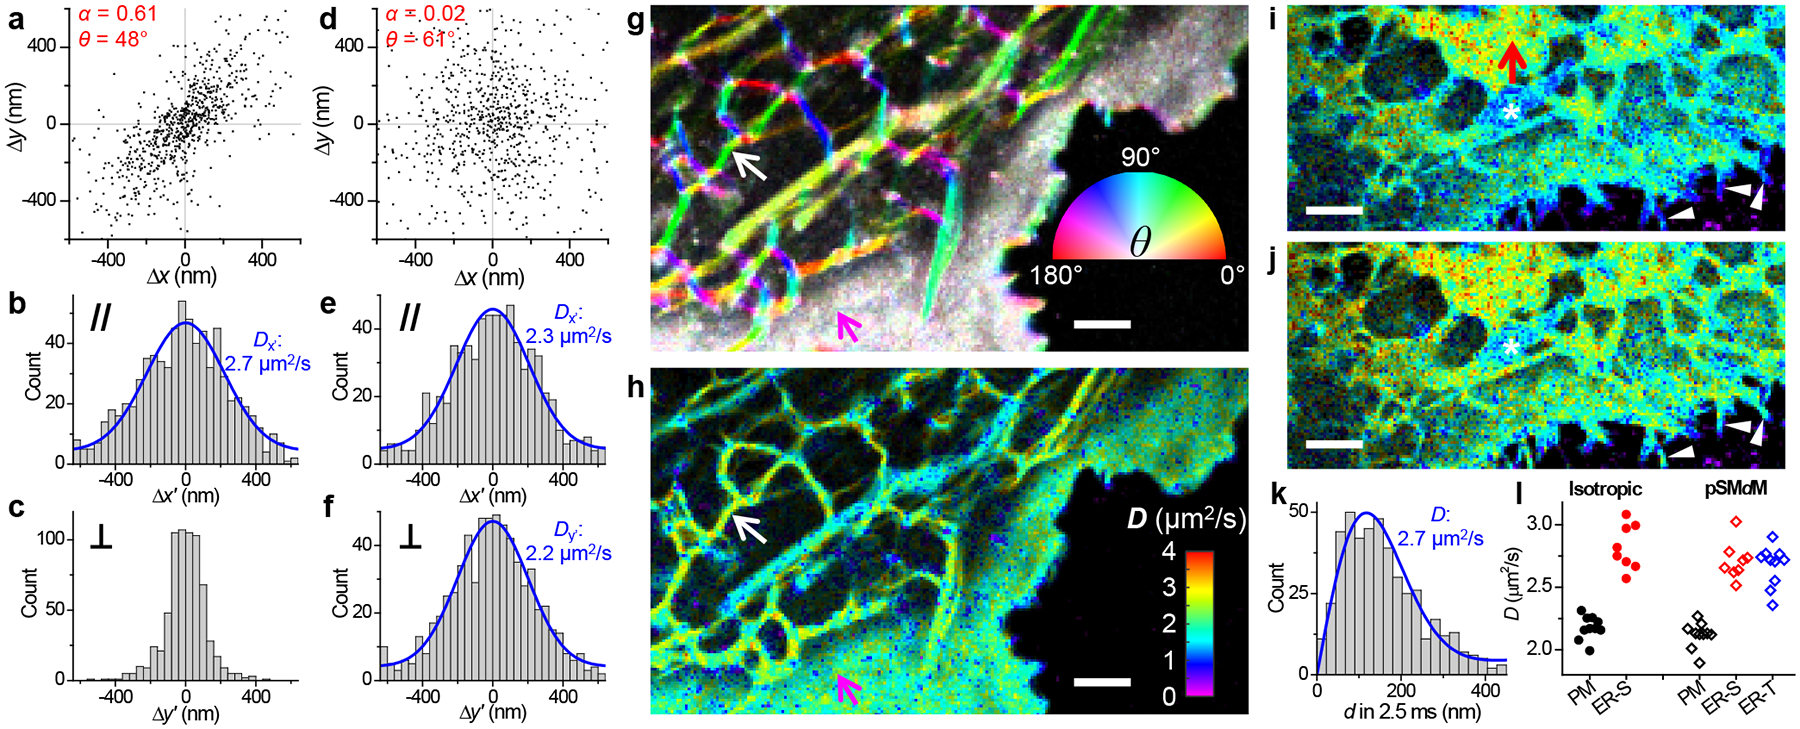
Figure 3.

Principal-direction SMdM (pSMdM) analysis. (a) 2D plot of single-molecule displacements in Δt = 9.1 ms for BDP-TMR-alkyne at an ER tubule [white arrows in (g,h)]. A principal direction θ of 48° is calculated with an anisotropy α of 0.61. (b,c) 1D distributions of the displacements in (a) projected along (b) and perpendicular (c) to θ. Blue curve in (b): MLE fit to an 1D diffusion model with resultant D = 2.7 μm2/s. (d) 2D plot of single-molecule displacements in Δt = 9.1 ms for BDP-TMR-alkyne at the plasma membrane [magenta arrows in (g,h)]. α = 0.02 and θ = 61°. (e,f) 1D distributions of the displacements in (d) projected along (e) and perpendicular (f) to θ. Blue curves: MLE fits to a 1D diffusion model, with resultant D = 2.3 and 2.2 μm2/s. (g) Color map presenting the calculated local θ (hue; inset color wheel) and α (color saturation; range 0–0.5) for the same region as Figure 2c. (h) pSMdM diffusivity map based on 1D diffusion fits along local principal directions. (i,j) SMdM (i) and pSMdM (j) diffusivity maps of another cell, acquired with tandem excitation pulses at Δt = 2.5 ms center-to-center separation, and presented on the same D color scale as (h). Asterisks mark a mitochondrion, for which D values are underestimated. (k) Distribution of single-molecule displacements in Δt for a region in the ER sheet [red arrow in (i)]. Blue curve: MLE fit, yielding D = 2.7 μm2/s. (l) Statistics for D values in the two samples obtained with isotropic SMdM (filled circles) and pSMdM (open diamonds). Each data point corresponds to an ~0.15 μm2 area containing signals solely from the plasma membrane (black), an ER sheet (red), or an ER tubule (blue). Scale bars: 2 μm (g,h,i,j).
