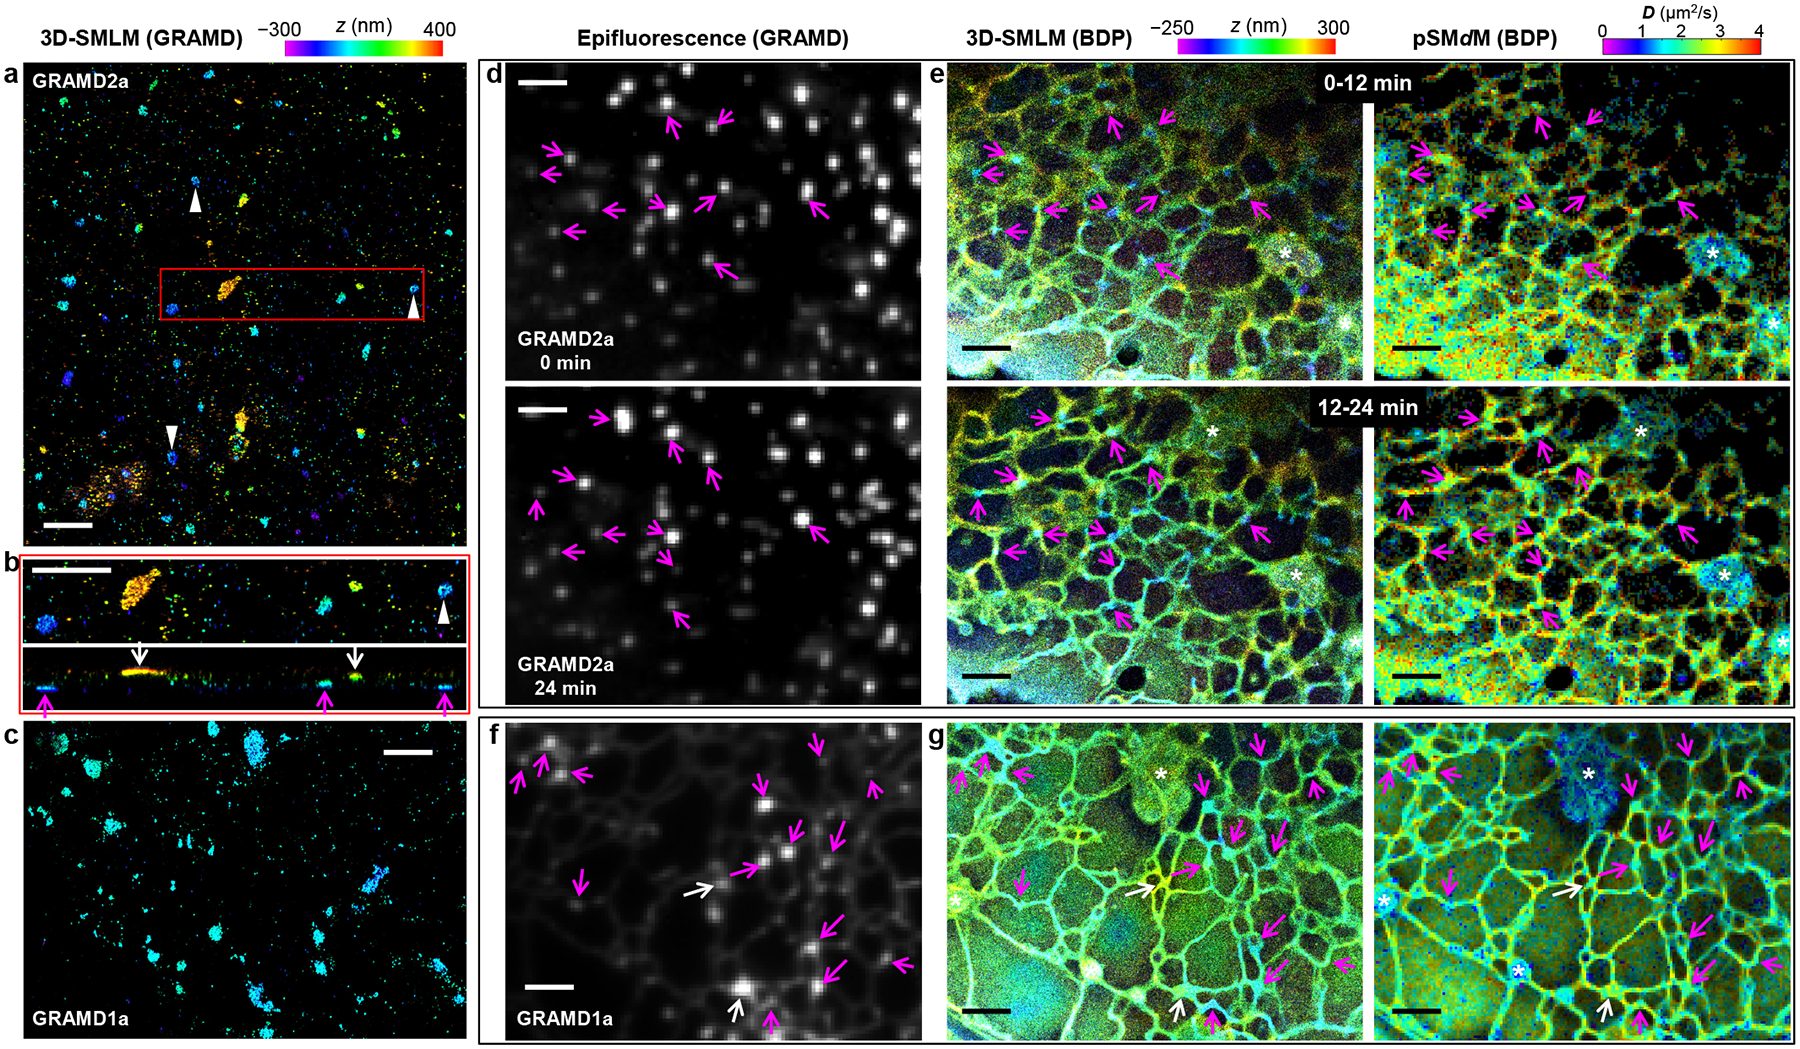
Figure 4.

Concurrent SMdM and 3D-SMLM, together with fluorescent protein markers, indicate reduced membrane diffusivity at ER-PM contact sites. (a) 3D-SMLM image of immunolabeled GRAMD1a-GFP expressed in a COS-7 cell. Color presents depth (color scale on the top). (b) Zoom-in of the red box in (a) (top) and its vertical view in the xz direction (bottom). Magenta and white arrows point to apparent contact sites at the ventral and dorsal plasma membranes, respectively. (c) 3D-SMLM image of immunolabeled GRAMD1a-GFP at the ventral plasma membrane of another COS-7 cell. (d) Live-cell epifluorescence images of GRAMD2a-GFP expressed in a COS-7 cell, taken before (top) and after (bottom) stroboscopic PAINT of BDP-TMR-alkyne. (e) 3D-SMLM (left) and pSMdM (right) images (separate color scales on the top) of the same region via stroboscopic PAINT of BDP-TMR-alkyne, for two consecutive 12-min periods. Data were acquired with tandem excitation pulses of τ = 1 ms duration at Δt = 2.5 ms. Arrows in (d,e) point to example GRAMD2a-positive ER-PM contacts. Asterisks mark mitochondria. (f) Epifluorescence image of GRAMD1a-GFP expressed in another live COS-7 cell. (g) 3D-SMLM (left) and pSMdM (right) images of BDP-TMR-alkyne of the same region. Data were acquired with excitation pulses of τ = 1 ms duration at the middle of each frame at Δt = 9.1 ms. Magenta and white arrows in (f,g) point to example GRAMD1a-positive contact sites at the ventral and dorsal membranes, respectively. Scale bars: 2 μm.
