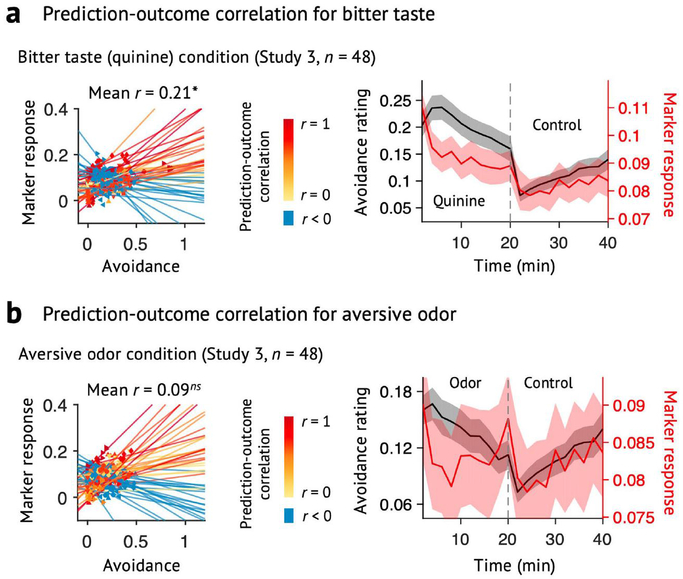
Extended Data Fig. 4 |. Specificity tests using a prediction approach (Study 3).
We used the ToPS to predict the avoidance ratings while participants were given a, bitter taste (quinine) or b, aversive odor. Left: Actual versus predicted ratings (that is, signature response) are shown in the plot. Signature response was calculated using the dot product of the model with the data. Signature response is using an arbitrary unit. Each colored line (or symbol) represents an individual participant’s data for across the treatment (quinine or aversive odor) and control runs (red: higher r, yellow: lower r, blue: r < 0). The exact P-values were P = 0.014 for bitter taste and P = 0.372 for aversive odor, two-tailed, bootstrap tests, n = 48. Right: Mean avoidance rating (black) and signature response (red) across the treatment and control runs. Shading represents within-subject s.e.m. Note that the left and right plots were based on averaging within five and ten time bins, respectively. ns = non-significant, *P < 0.05.

