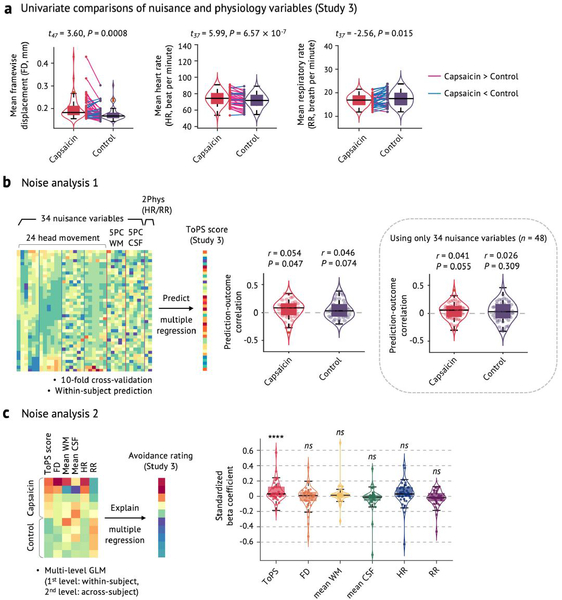
Extended Data Fig. 5 |. Noise analysis.
a, Univariate comparisons of head motion (framewise displacement, FD) and physiological measures (heart rate, HR, and respiratory rate, RR) between the capsaicin versus control conditions with the independent test dataset (Study 3, n = 48). We used the violin and box plots to show the distributions of the values. The box was bounded by the first and third quartiles, and the whiskers stretched to the greatest and lowest values within median ±1.5 interquartile range. The data points outside of the whiskers were marked as outliers. Note that 10 participants’ physiological data were excluded due to technical issues with acquisition (remaining n = 38). For statistical testing, paired t-tests (two-tailed) were conducted. b, Noise analysis 1. To examine whether the nuisance and physiology variables explain the Tonic Pain Signature (ToPS) response, we trained a model to predict the ToPS scores based on 34 nuisance variables + 2 additional physiology variables with Study 3 data. The 34 nuisance variables included 24 head motion parameters (6 movement parameters including x, y, z, roll, pitch, and yaw, their mean-centered squares, their derivatives, and squared derivative), 5 principal component scores derived from white matter (WM), and 5 principal component scores derived from cerebrospinal fluid (CSF). The 2 physiological variables were heart rate and respiratory rate. Because the effects of these confounding variables can be different across individuals and conditions, we trained predictive models for each condition and for each individual. To achieve more stable and unbiased predictive performance, we divided the data into 40 time-bins (each bin was 30 seconds) and conducted 10-fold cross-validation. Prediction-outcome correlation coefficients are visualized with violin and box plots. For statistical testing, we used one-sample t-test, two-tailed. c, Noise analysis 2. To test whether the ToPS responses can explain tonic pain ratings above and beyond the nuisance and physiology variables, we conducted multi-level general linear model (GLM) analysis (n = 38) using data averaged within 10 time bins for each individual across capsaicin and control condition (5 bins per condition), which is the same binning scheme as our main prediction results (Fig. 2c). To obtain standardized beta coefficients, all the features were z-scored. The exact P-values were (from left to right) 1.86 × 10⁻⁸ (ToPS), 0.231 (FD), 0.145 (mean WM), 0.270 (mean CSF), 0.270 (HR), and 0.272 (RR), two-tailed, multi-level GLM with bootstrap tests, 10,000 iterations. Overall, participants moved more and showed heart-rate acceleration during capsaicin (a), but the ToPS model was independent of movement and physiological variables (b). ToPS predicted pain avoidance ratings controlling for movement and physiological nuisance variables, but the nuisance variables themselves did not predict avoidance ratings. ns = not significant; ****P < 0.0001.

