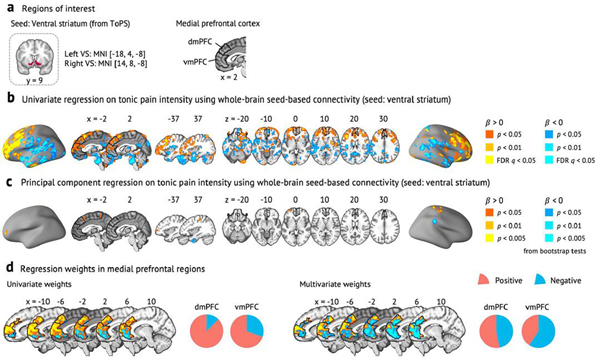
Extended Data Fig. 8 |. Ventral striatum seed-based connectivity analysis.
a, We used the bilateral ventral striatum (VS) ROIs from the ToPS model as a seed to construct whole-brain seed-based connectivity maps for each time-bin of Study 1 data (n = 19). We had a particular interest in the weight patterns within the two medial prefrontal regions, dorsomedial and ventromedial prefrontal cortices (dmPFC and vmPFC). With the whole-brain connectivity maps, b, we first conducted the univariate GLM analysis. For each individual, we regressed the VS seed-based functional connectivity (Y) on pain intensity ratings (X) across capsaicin and control runs and performed second-level t-tests on the beta maps, treating participant as a random effect. Here we show the results for FDR-corrected q < 0.05 (corresponding to uncorrected P = 0.001), pruned with uncorrected P < 0.01 and 0.05 (two-tailed). c, We also conducted a multivariate analysis, in which we used the principal component regression (PCR) with reduced number of PCs to predict pain intensity ratings based on VS seed-based connectivity across capsaicin and control condition. The number of PCs was selected based on cross-validated within-individual predictive performance (#PC = 45; mean prediction-outcome r = 0.25, P = 0.002, two-tailed, bootstrap test). To identify important brain regions, we conducted the bootstrap test for the PCR with 10,000 iterations. Here we show the results for P < 0.005 uncorrected, pruned with P < 0.01 and 0.05, two-tailed. d, Regression weights in the medial prefrontal regions, focusing on the dorsomedial and ventromedial prefrontal cortices (that is, dmPFC and vmPFC). The left panel shows the unthresholded univariate map from b, and the right panel shows the unthresholded multivariate regression map from c. The pie chart represents the proportion of positive (red) and negative (blue) weights in each of the medial prefrontal regions. Across both univariate and multivariate maps, a dorsal-ventral gradient (dorsal: more positive, ventral: more negative) was found in the medial prefrontal cortex. Black lines show the contours of dmPFC and vmPFC regions.

