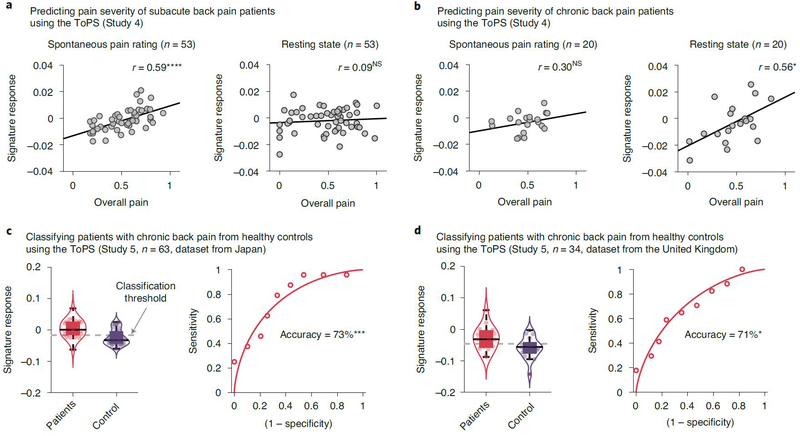
Fig. 3 |. Testing the ToPS on the clinical pain data.
a, b, We tested the ToPS on a publicly available clinical pain dataset5,24–26 (Study 4) to evaluate how much the model can explain clinical pain severity of (a) patients with subacute back pain (SBP; n = 53) and (b) patients with chronic back pain (CBP; n = 20). The plots show the relationships between the actual pain scores (visual analog scale) versus signature response (arbitrary unit). Each dot represents an individual participant, and the line represents the regression line. The exact P values and degrees of freedom (d.f.) were (a) P = 3.91 × 10⁻⁶ (left) and 0.528 (right), d.f. = 51; (b) P = 0.197 (left) and 0.011 (right), d.f. = 18; two-tailed, one-sample t-test. c, d, We further tested the ToPS on two publicly available datasets26 to evaluate how well the model can classify the patients with CBP from healthy control participants. One dataset (c) was obtained from Japan (n = 63), which included 24 patients and 39 healthy participants. The other dataset (d) was obtained from the United Kingdom (n = 34), which included 17 patients and 17 healthy participants. The exact P values were P = 0.0003 for c and P = 0.024 for d, two-tailed, binomial tests. *P < 0.05, ***P < 0.001 and ****P < 0.0001. NS, not significant.

