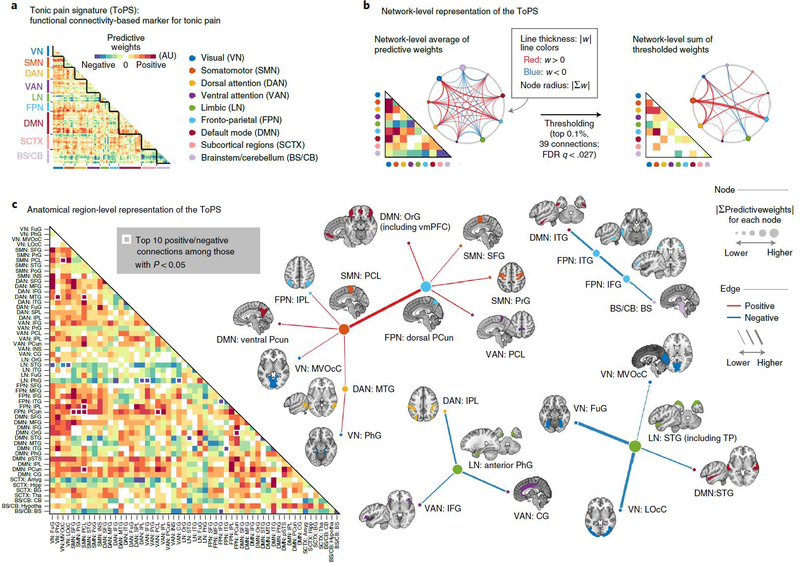
Fig. 4 |. ToPS: a functional connectivity marker for tonic pain.
a, The raw predictive weights of the model. We sorted the brain regions according to their functional network membership. b, Left: we averaged the ToPS predictive weights for each network and displayed them with a lower triangular matrix and a circular plot. Right: we summed the top 0.1% thresholded weights based on bootstrap test with 10,000 iterations (P < 0.000028, FDR-corrected q < 0.027, two tailed) at the network level. c, We grouped the parcels into gross anatomical regions within each functional network and averaged the predictive weights within each anatomical region. The top ten positive and negative connections and the corresponding brain regions that survived at a threshold of uncorrected P < 0.05 with bootstrap tests (two tailed, white boxes on the left panel) were shown with force-directed graph layout. AU: arbitrary unit; Amyg, amygdala; BS, brainstem; BG, basal ganglia; CB, cerebellum; CG, cingulate gyrus; FuG, fusiform gyrus; Hipp, hippocampus; Hypotha, hypothalamus; IFG, inferior frontal gyrus; INS, insular gyrus; IPL, inferior parietal lobule; ITG, inferior temporal gyrus; LOcC, lateral occipital cortex; MFG, middle frontal gyrus; MTG, middle temporal gyrus; MVOcC, medioventral occipital cortex; OrG, orbital gyrus; PCL, paracentral lobule; PCun, precuneus; PhG, parahippocampal gyrus; PoG, postcentral gyrus; PrG, precentral gyrus; pSTS, posterior superior temporal sulcus; SFG, superior frontal gyrus; SPL, superior parietal lobule; STG, superior temporal gyrus; Tha, thalamus.

