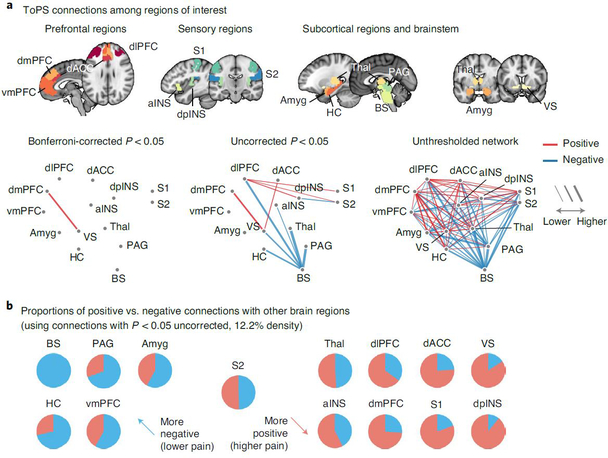
Fig. 5 |. ToPS connections among ROis.
a, We examined the ToPS predictive weights among the ROIs that have been often studied in the field of pain neuroimaging, including prefrontal (vmPFC, dmPFC, dlPFC and dACC), sensory (S1, S2, aINS and dpINS), subcortical (thalamus, ventral striatum, amygdala and hippocampus) and brainstem (PAG and brainstem) regions. We displayed these connections with three different levels of threshold. Left: Bonferroni correction P < 0.05; middle: uncorrected P < 0.05; right: no threshold. P values were obtained from bootstrap tests with 10,000 iterations (two tailed). b, For each pain-related brain region, we show proportions of positive versus negative connections with other brain regions with pie charts (red. positive; blue, negative). We used only the connections that survived at a threshold of uncorrected P < 0.05 (bootstrap tests, two tailed) for calculating proportions. Brain regions with a higher proportion of negative connections are shown on the left side (meaning lower pain with increasing connectivity), and those with a higher proportion of positive connections are shown on the right side (meaning higher pain with increasing connectivity).

