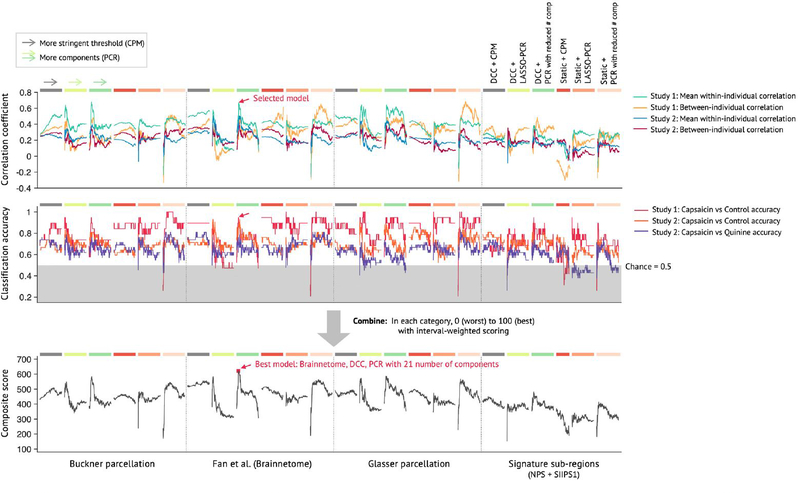
Extended Data Fig. 3 |. Model competition results of pain intensity models.
Using multiple candidate models generated from the model development step (see Extended Data Fig. 2 and Methods for details), we conducted a model competition using 7 predefined criteria. The criteria consist of 4 correlation coefficients (within- and between-individual prediction-outcome correlations of Studies 1 and 2; shown in the top panel), and 3 classification accuracy values (for Capsaicin vs. Control in Studies 1 and 2, and for Capsaicin vs Quinine in Study 2; shown in the middle panel). Dotted lines separate different parcellations, and colored bars on the top of the plots (gray, light green, green, red, orange, and pink) represent different options of connectivity calculation methods and algorithms (see the top right for detailed description for each color bar). For CPM-based models (gray and red color bars), thresholds become more stringent from the left to the right. For PCR-based models (light green, green, orange, and pink), more PCs were used from the left to the right. To combine the 7 different performance metrics, we used a percentile-based scoring method (ranging from 0 to 100 for each criterion). The combined score (possible range: 0 to 700) was shown in the bottom panel, and the selected best model was indicated with the red arrow on the plots. Here we show the competition results only for the predictive model for pain intensity.

