Figure 4.
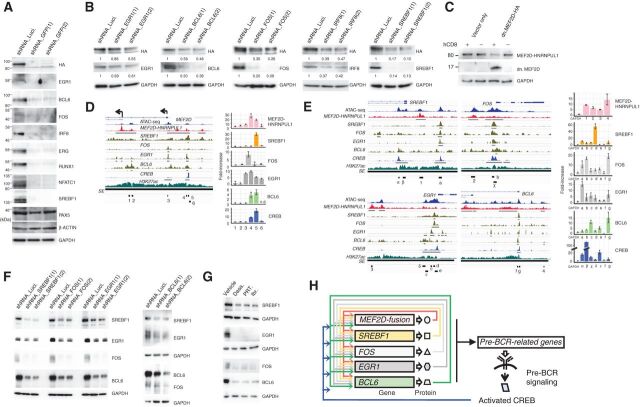
Identification of TFs comprising the CRC. A, Knockdown of MEF2D-HNRNPUL1 reduces the expression of the indicated TFs. Two GFP-targeting shRNAs were used. PAX5, β-actin, and GAPDH served as controls. B, Knockdown of the indicated putative CRC components reduced MEF2D-HNRNPUL1 expression. Two independent shRNAs were used per component. GAPDH served as a loading control. Relative signal strengths normalized on the basis of GAPDH signals are presented. C, Enforced expression of a truncated form of MEF2D downregulated MEF2D-HNRNPUL1 expression. K7-HA-GFP cells were infected with a lentiviral vector encoding an HA-tagged, truncated form of MEF2D; this form encompassed the first 117 amino acids that encode DNA-binding domains but lacked the C-terminal transcriptional regulatory domains. The vector additionally expressed hCD8 to enable the fractionation of infected (hCD8-positive) from uninfected (hCD8-negative) cells. The expression of MEF2D-HNRNPUL1 and truncated MEF2D in fractionated cells were analyzed using an anti-HA antibody. D, Occupancy of MEF2D-HNRNPUL1 and ATAC-seq and H3K27ac ChIP-seq signals detected around the transcription start sites (TSS) of MEF2D in K7-HA-GFP cells are presented. Also shown are SREBF1, FOS, EGR1, and CREB ChIP-seq signals in GM12878 B lymphoid cells derived from the Encode project, as well as BCL6 ChIP-seq signals detected in pre-B lymphocytes (GSM1438986). SEs and ChIP-seq signal peaks are indicated by black lines (left). ChIP-qPCR analysis of the occupancy of six regions (indicated as 1–6) in the left panel by MEF2D-HNRNPUL1, SREBF1, FOS, EGR1, BCL6, and CREB in K7-HA-GFP cells (right). The fold-increases in the amounts of DNA precipitated by antibodies specific for the indicated TFs were compared with those precipitated by normal IgG and are shown as means ± SDs (n = 3). E, Occupancy of MEF2D-HNRNPUL1 and ATAC-seq and H3K27ac ChIP-seq signals around the TSSs of SREBF1, FOS, EGR1, and BCL6 in K7-HA-GFP cells are presented. SREBF1, FOS, EGR1, BCL6, and CREB ChIP-seq signals are also presented as in D. SEs and ChIP-seq signal peaks are indicated by black lines (left). ChIP-qPCR analysis of occupancy of MEF2D-HNRNPUL1, SREBF1, FOS, EGR1, BCL6, and CREB at the indicated regions (shown in the left) is presented (n = 3) as in D (right). F, Knockdown of either SREBF1, FOS, EGR1, or BCL6 reduced the expression of the other three TFs. G, Treatment of Kasumi-7 cells with the indicated pre-BCR signaling inhibitors as in Fig. 3F reduced the protein expression of SREBF1, EGR1, FOS, and BCL6. H, A putative CRC.

