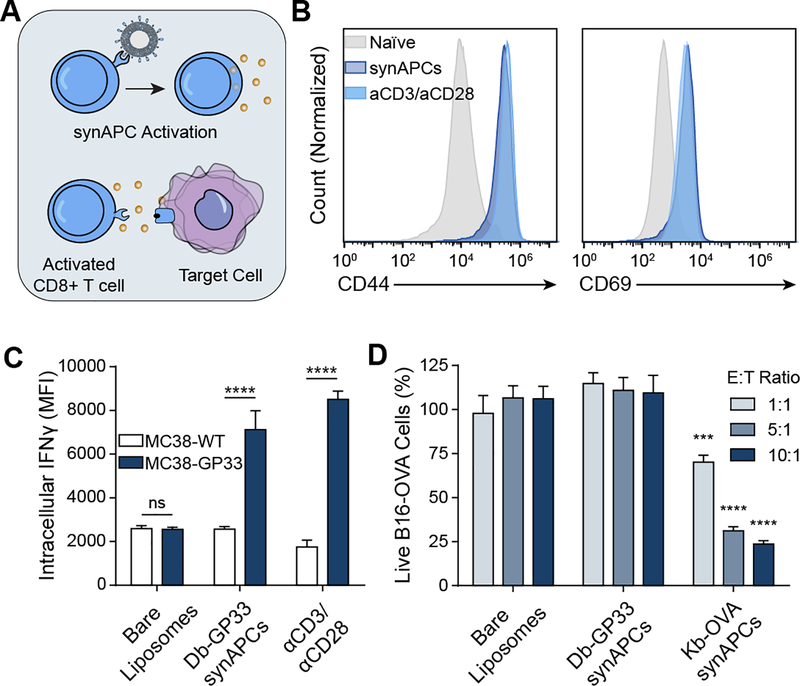
Figure 3.
T cells activated by synAPCs in vitro demonstrate cytotoxic activity. (A) pMHC liposomes stimulate T cells through pMHC-TCR interactions. Activated T cells then exert cytotoxic effects on target cells. (B) Histograms of CD44 and CD69 expression on T cells stimulated with synAPCs or anti-CD3/anti-CD28 antibodies. (C) P14 CD8+ T cells activated with Db-GP33 synAPCs have higher IFNγ expression when incubated with target cells pulsed with GP33 peptide than when incubated with control cells. Data shown as mean ± s.d. n=3 ****p<0.0001 by two-way ANOVA with Tukey’s multiple comparison test. (D) OT1 CD8+ T cells stimulated with Kb-OVA synAPCs show cytotoxic activity against B16-OVA target cells. Data shown as mean ± s.d. n=4 ***p<0.001, ****p<0.0001 by two-way ANOVA with Tukey’s multiple comparison test. Significance relative to untargeted controls at same E:T ratio.

