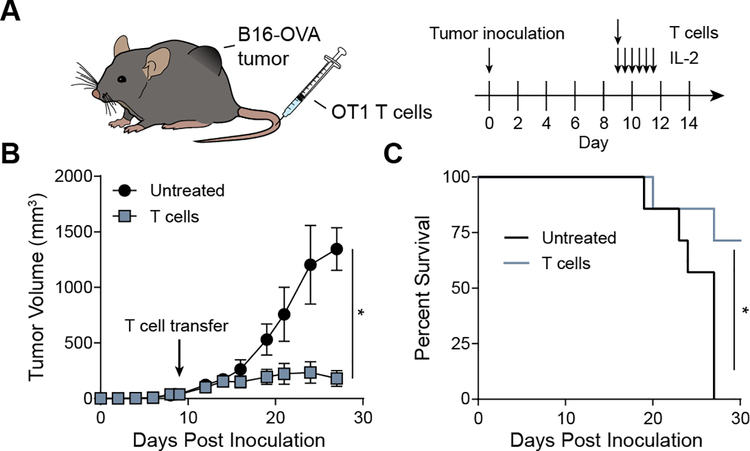
Figure 5.
Adoptive transfer of T cells activated by synthetic APCs controls tumor growth. (A) Timeline of ACT experiment. (B) Tumor growth curves for mice with and without treatment. Data shown as mean ± s.d. n=7 *p<0.05 by two-way ANOVA. (C) Survival curve for mice without and without treatment. *p<0.05 by log-rank test.

