
FIGURE 2.
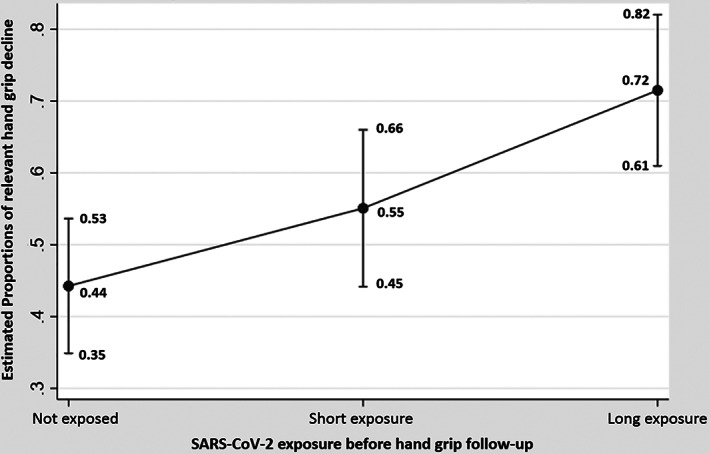
Graph plot showing differences in estimated proportions of hand grip strength decline >5% across individuals who remained seronegative versus those who had long exposure versus short exposure to SARS‐CoV‐2
Official websites use .gov
A
.gov website belongs to an official
government organization in the United States.
Secure .gov websites use HTTPS
A lock (
) or https:// means you've safely
connected to the .gov website. Share sensitive
information only on official, secure websites.
Graph plot showing differences in estimated proportions of hand grip strength decline >5% across individuals who remained seronegative versus those who had long exposure versus short exposure to SARS‐CoV‐2