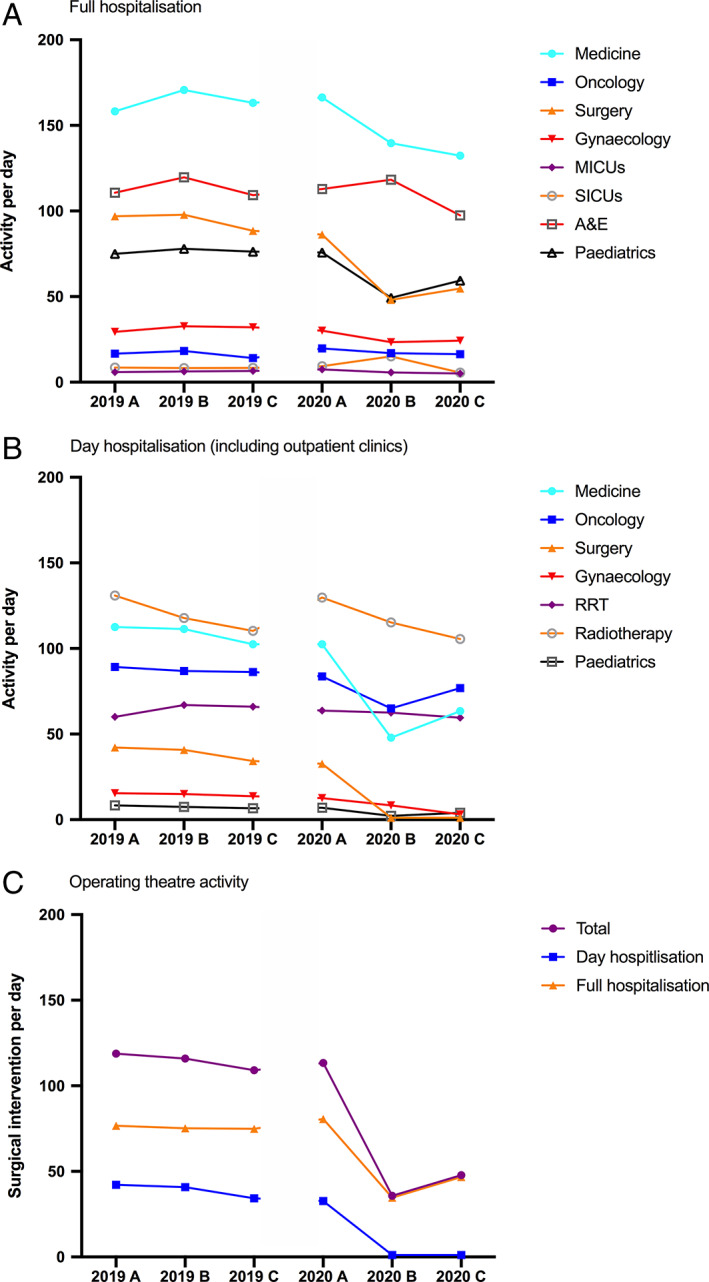
FIGURE 1.

Mean activity per day for 2019 and 2020. Hospital activity is expressed as mean per day for (A) full hospitalization and (B) for day hospitalization for each subperiod A (24 Feb to 15 Mar), B (16 Mar to 13 Apr), and C (14 Apr to 31 May). (C) Mean number of surgical intervention per day. A&E, accident and emergency department; MICUs, medical ICUs, RRT: renal replacement therapy unit; SICUs, surgical ICUs [Color figure can be viewed at wileyonlinelibrary.com]
