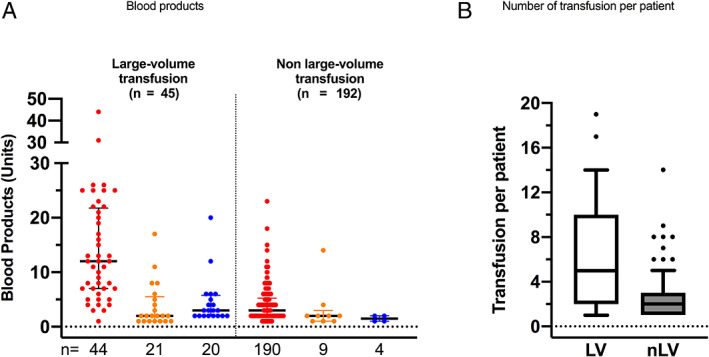
FIGURE 4.

Transfusion in transfused COVID‐19 patients. (A) Scatter plot with median and interquartile of large‐volume (left) and non‐large‐volume (right) transfused products: red blood cell packs in red, platelet concentrates in orange and fresh frozen plasma in blue and (B) whisker boxes (horizontal line inside box median, upper and lower box limits 25–75 percentiles and T‐bars 10–90 percentiles respectively) of number of transfusion per patients during all the stay (LV, large‐volume; nLV, non‐volume transfused patients) [Color figure can be viewed at wileyonlinelibrary.com]
