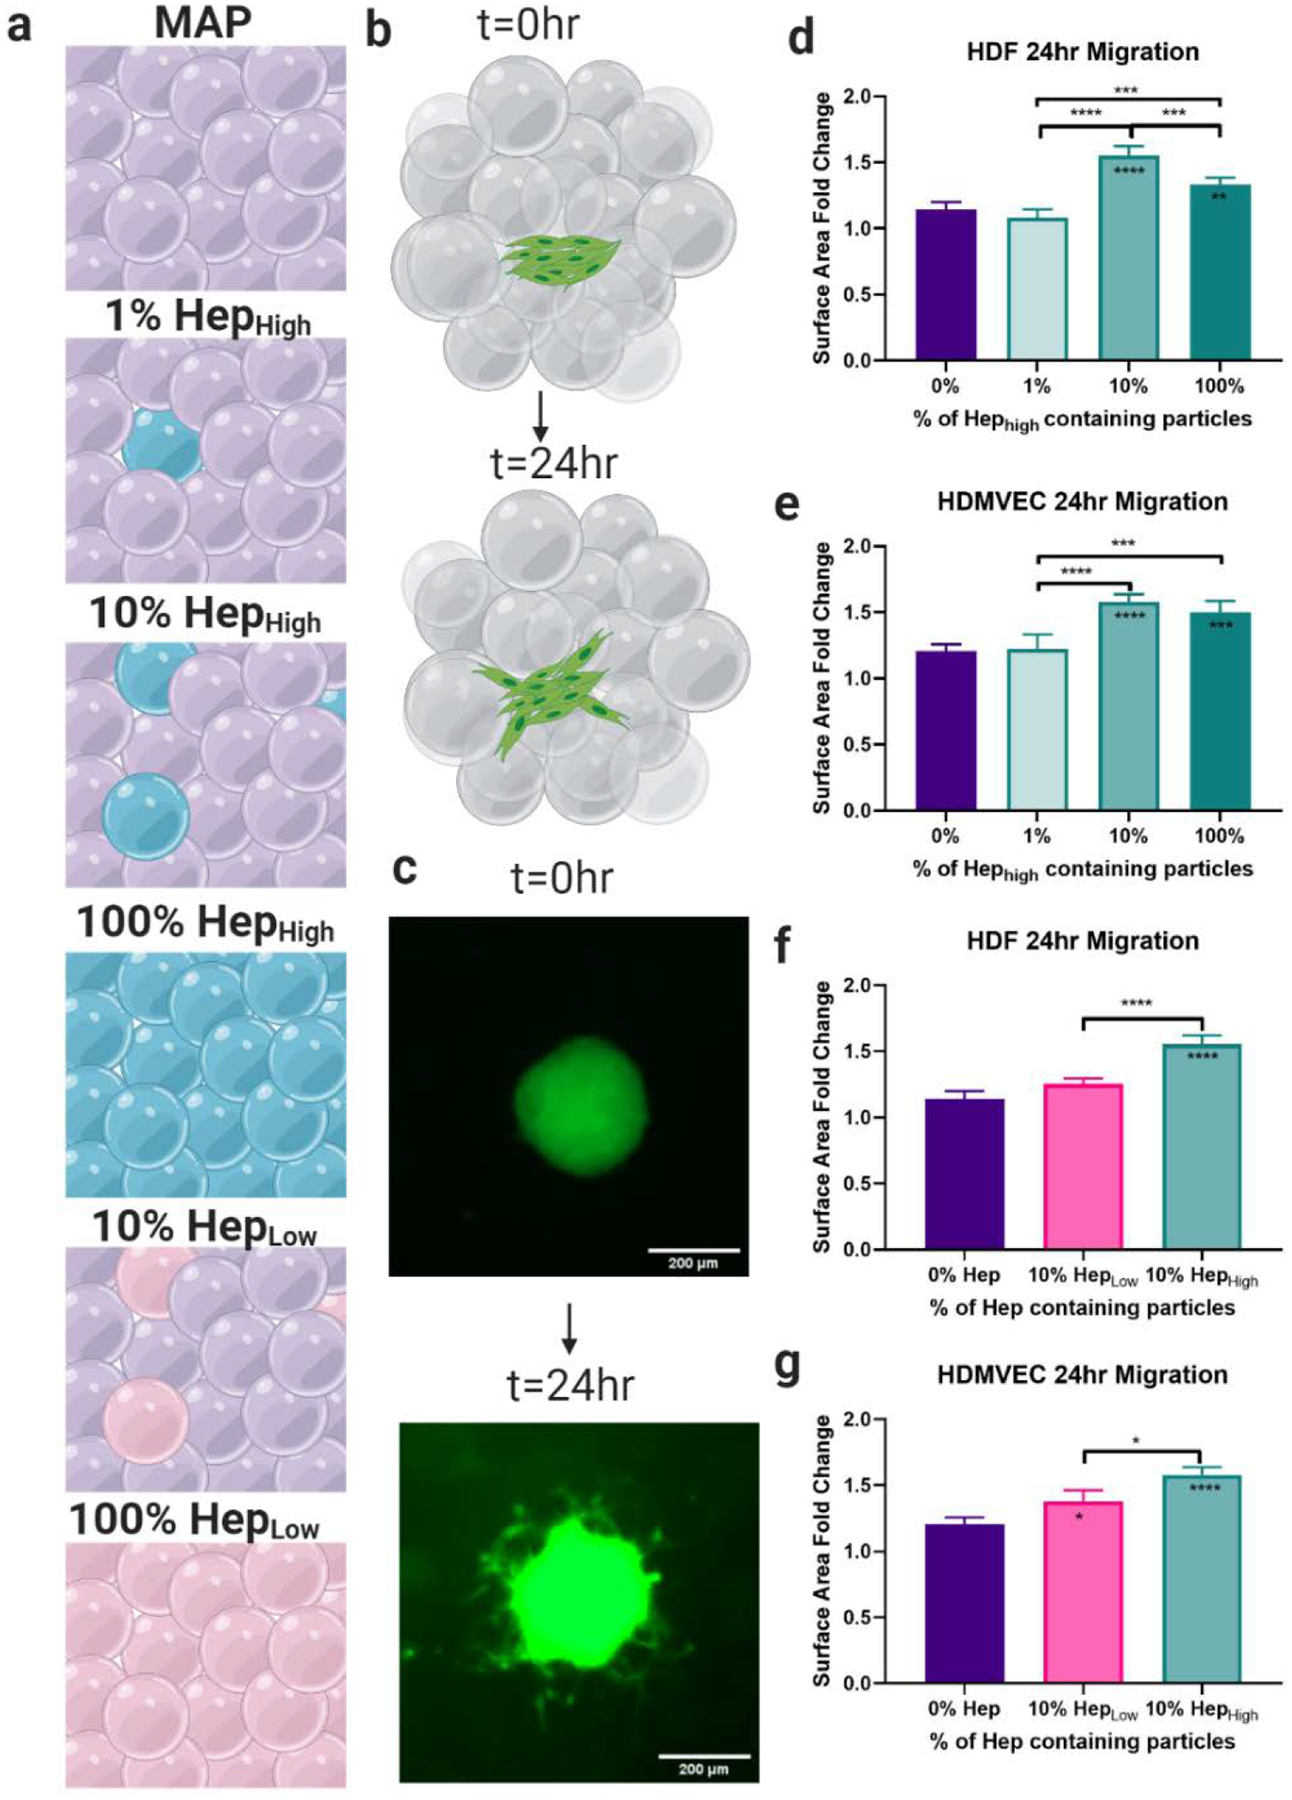
Figure 2.

Cellular Migration. a) Six gel conditions were compared with varying concentrations and percentages of heparin particles. b) A spheroid migration assay was used to quantify cell migration over 24 hours. c) Representative images of spheroids at 0 and 24 hrs. d) Quantification of cell migration showed the 10% HepHigh μIslands exhibited the highest migration of Human Dermal Fibroblasts (HDFs) and e) Human Dermal Microvascular Endothelial Cells (HDMVECs) compared to all other groups with the same concentration of heparin, but different spacing. f) The 10% HepHigh μIslands significantly outperformed the 10% HepLow μIslands for HDFs and g) HDMVECs, confirming that both the concentration of heparin and the spacing of heparin particles affect cell migration. All graphs show mean +/− standard deviation. Statistics: ANOVA, Multiple comparisons post-hoc tests (Tukey HSD). N=4. Significance inside of bars represents comparison to no hep gels. *p<0.05, **p<0.01, ***p<0.001, ****p<0.0001.
