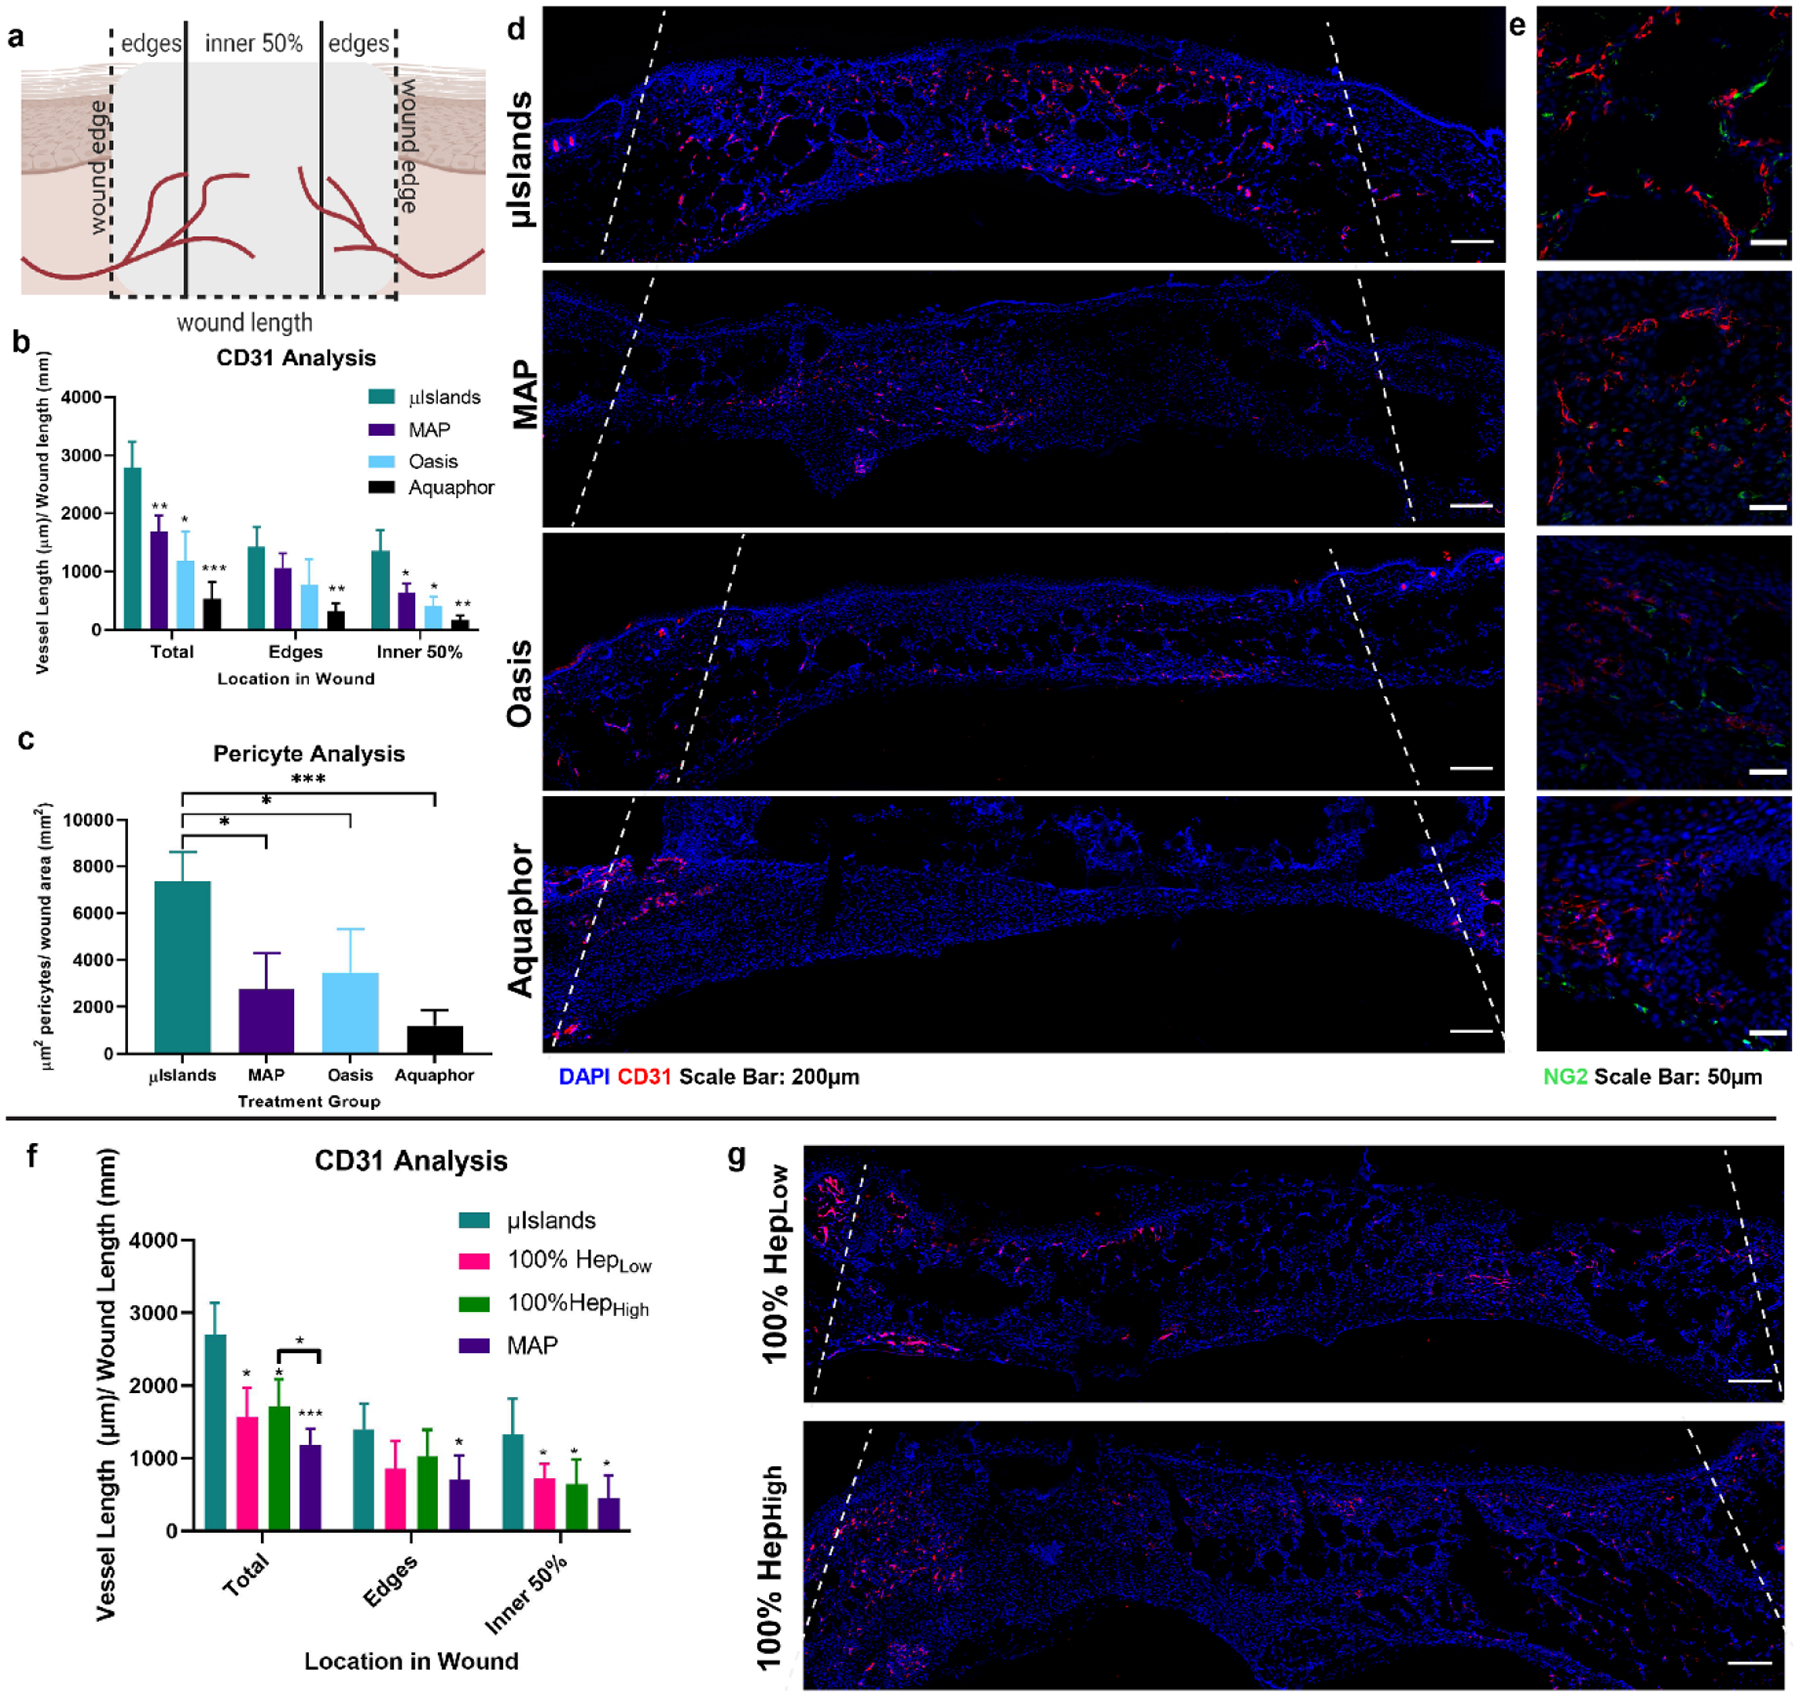
Figure 4.

Vascularization at Day 7 in a Diabetic Wound Healing Model. a) Vessel analysis was performed to determine the extent of vascularization throughout the wound. b) Vessel length was quantified for the middle and edges of the wound at Day 7 as determined by CD31 staining. c) Pericyte analysis was performed to assess the presence of mature vasculature as indicated by proximal NG2 staining to a blood vessel. d) Representative images of the four treatment groups CD31 staining Day 7 and e) pericyte staining. f) Vessel length localization at Day 7 in the follow-up wound healing study. g) Representative images of vascularization for the 100% HepLow and 100% HepHigh groups. Wound edges marked by dashed line. All graphs show mean +/− standard deviation. Statistics: ANOVA, Multiple comparisons post-hoc tests (Tukey HSD). N=6 for a-e, N=7 for f,g. *p<0.05, **p<0.01, ***p<0.001.
