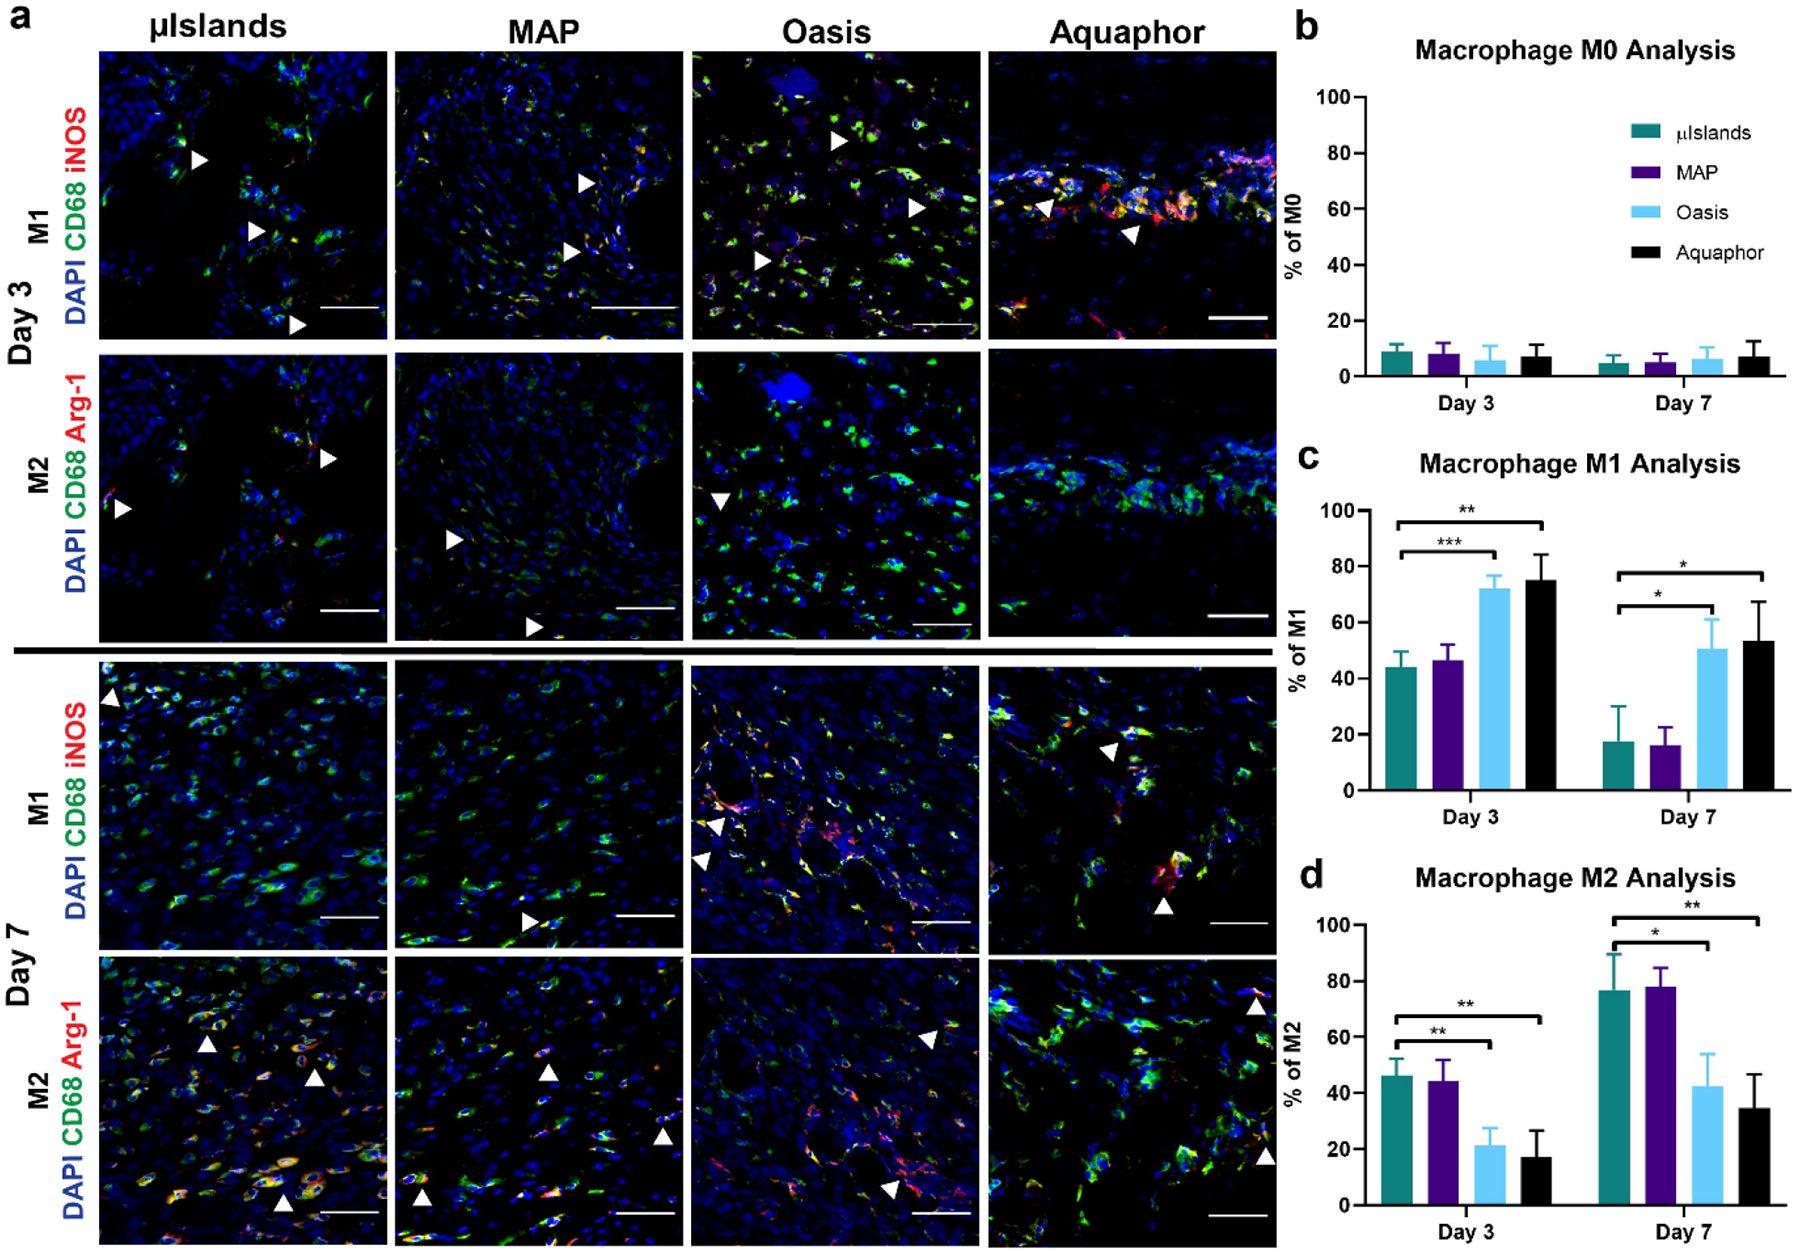
Figure 5.

Macrophage Polarization. a) Representative images at Day 3 and Day 7 of macrophage M1 and M2 polarizations. Scale bar represents 50μm. b) Percentage of macrophages in the wounds for each group at Day 3 and 7 that only stained positive for CD68. c) Percentage of macrophages in the wounds that stained positive for the M1 inflammatory phenotype as indicated by CD68+ and iNOS+. d) Percentage of macrophages in the wounds that stained positive for the M2 pro-regenerative phenotype as indicated by CD68+ and Arg-1+. All graphs show mean +/− standard deviation. Statistics: ANOVA, Multiple comparisons post-hoc tests (Tukey HSD). N=6. *p<0.05, **p<0.01, ***p<0.001.
