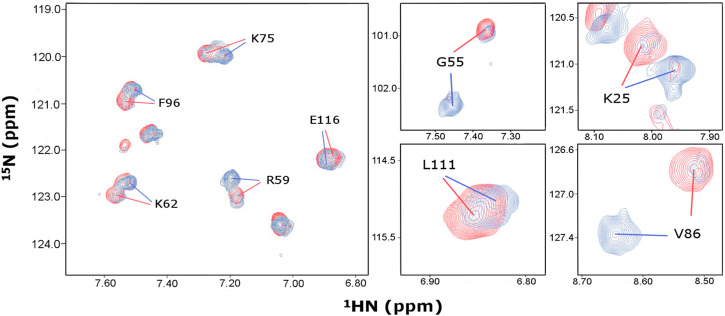
FIGURE 2.
Identification of distinct chemical shift assignments at 466 and 153 μM P protein concentrations. Overlay of 1H, 15N-HSQC spectra acquired on samples containing 466 μM (red) and 153 μM (blue) P protein concentrations under identical buffer conditions at 318K. Representative regions of the spectra are shown, revealing slow exchange between monomer and dimer conformers in solution. Amino acid single letter code and T. maritima RNase P protein numbering corresponds to UniProtKB–Q9X1H4.

