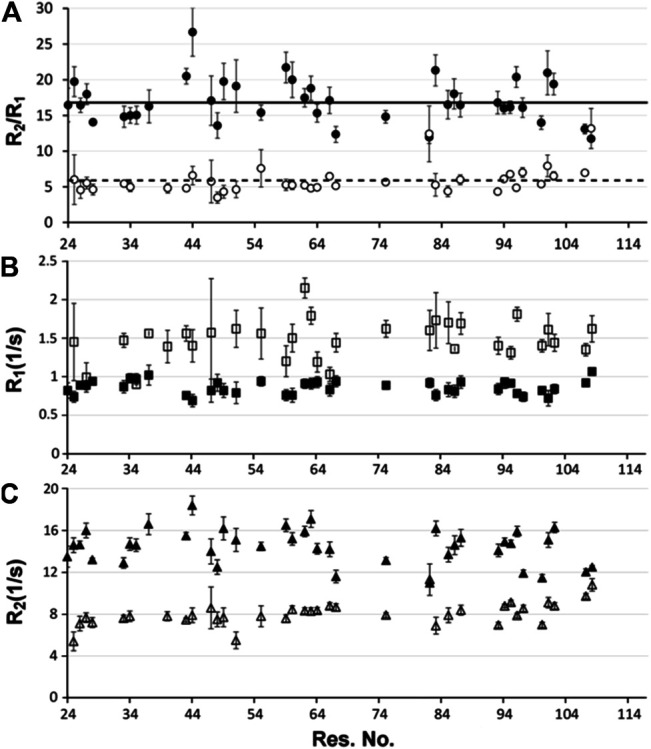
FIGURE 3.

NMR relaxation analysis (A) R2/R1 ratios, (B) R1 and (C) R2 of distinct T. maritima RNase P protein conformers. The dominant P protein conformer at 466 μM is shown in filled circles, rectangles, and triangles in the three plots, respectively; while the minor conformer is presented as the open/white filled symbols. The R2/R1 ratio (A), as well as individual R1 (B) and R2 (C) relaxation experiments were performed on a 466 uM P protein sample at 318K. For each data set, errors represent multiple 15N T2 and T1 relaxation experiments in addition to the uncertainty of the exponential fit. The average R1, R2, and R2/R1 ratios of the dominant and minor P protein conformations are indicated as solid and dashed lines, respectively.
