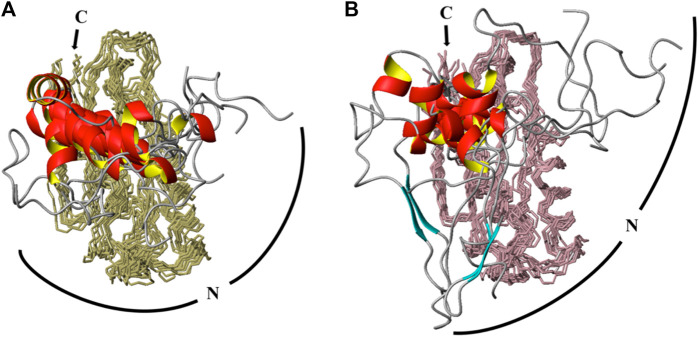
FIGURE 4.
CS-Rosetta calculated ensembles of T. maritima P protein at high (466 μM) and low (153 μM) concentrations. The same number of chemical shifts arising from the same residues (distributed equally) for identified monomer and dimer conformations were incorporated into CS-Rosetta calculations. The top 10 scored models of each conformation are overlaid in A (at 466 μM) and B (at 153 μM). In both ensembles, 10 structures models are superposed from residue 24 to 117, with backbone regions colored olive (A) and light pink (B). The N-terminus region (residues 1–23) are presented as loop (gray coil-coiled) and ribbons (red helix) segments. The C-terminus (C) is labeled and a curved line of the N-terminus (N) is included to highlight the predicted amplitudes and flexibility observed in the dimer (A) and monomer (B) derived ensembles.

