FIGURE 5.
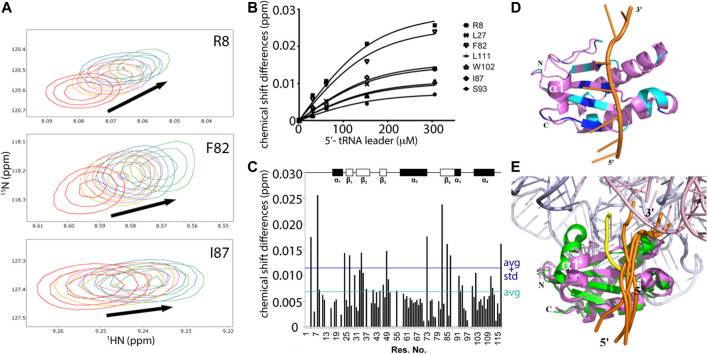
NMR mapping and modeling of the P protein-5’ pre-tRNA leader interaction. (A) Representative chemical shift perturbations (CSP) corresponding to RNA titrations to a 153 μM P protein sample. Overlay of 1H, 15N-HSQC spectra show the chemical shift changes due to RNA binding, where RNA-protein ratios are 0:1 (red), 0.2:1 (orange), 0.4:1 (purple), 1:1 (blue), and 2:1 (green). (B) Example curves included in global fitting of deriving dissociation constant of T. maritima P protein-5’ leader interaction (KD = 47.2 ± 14.0 μM, R 2 = 0.983). (C) CSP map of ligand-protein molar ratio at 2:1, with indicated chemical shift changes (∆δ) (y-axis) by residue (x-axis). The dark blue line represents one standard deviation above the average chemical shift difference (∆δaverage + STD∆δ). The cyan line represents the average chemical shift difference (∆δaverage). Schematic plot shows the P protein secondary structure (top). (D) The best scored HADDOCK model of the P protein-5’ leader interaction in solution. The lowest energy NMR-derived CS-ROSETTA model (violet) is depicted as ribbons (helix) and arrows (β-sheets) and the 5’ leader RNA is shown as a cartoon (orange backbone trace and green/blue nucleobases). Residues with significant CSP (Δδ ≥ ∆δaverage + STD∆δ) are highlighted in dark blue, and residues with large CSP (∆δaverage + STD∆δ ≥ Δδ ≥ ∆δaverage) are colored in cyan. The CS-Rosetta generated model derived from monomeric chemical shift data was used in HADDOCK calculations to compare NMR-based data in solution to the available X-ray data (PDBs 1NZ0 and 3Q1R). (E) A structural overlay of the HADDOCK generated models (protein/5’ leader, colored as violet/orange) in the context of the bacterial RNase P holoenzyme crystal structure, which emphasizes the P protein-5’ leader interface, colored green/yellow, that is derived from electron density data (PDB 3Q1R). 4 HADDOCK models with the lowest energies were superposed with PDB 3Q1R. The RNase P RNA and tRNA are colored light blue and pink, respectively, and the 5’ and 3’ ends of the leader RNAs are labeled.

