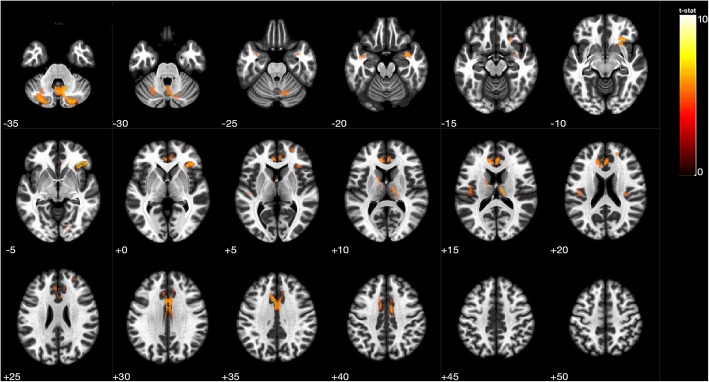
Fig. 1.
Comparison of gray matter volume between CSVD patients and control participants. The numbers represents the z-axis coordinates of the corresponding plane. Red to yellow represents regions of the brain that have more significant gray matter atrophy in CSVD patients than controls at a threshold of p < 0.0001,after adjusting for age, sex and AHI. These brain regions include the bilateral cerebellum, right superior frontal gyrus, right inferior frontal gyrus, right thalamus, right temporal pole, right superior temporal gyrus, right lingual gyrus, right medial cingulate cortex and left anterior cingulate cortex

