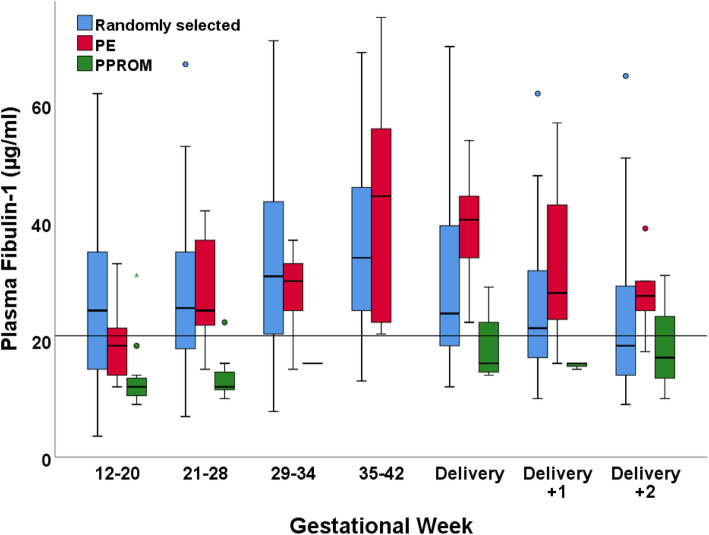
Fig. 2.
Gestational age-specific variation in plasma fibulin-1 levels during pregnancy. Plasma fibulin-1 concentrations in 632 samples from 128 healthy pregnant Caucasian women. The box plots represent the range of data from the 25th to the 75th percentiles, while the bar in the middle of each box plot represents the median value. The whiskers extending from the box represent the range of values, excluding outliers. Circles indicate outliers (1.5 x the interquartile range). The line represents the 90th reference percentile in blood donors

