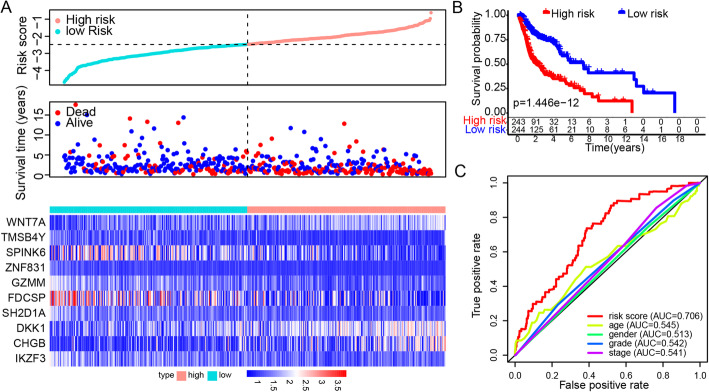
Fig. 2.
Construction of the DEG-based gene signature prognostic model. A Risk score, vital status and heatmap of prognostic genes in the high- and low-risk groups. B Kaplan-Meier survival curves of the relative overall survival of high- and low-risk patients. C The ROC curve for one-year survival of the gene signature and clinical features. DEGs were identified between TP53 mutated and wildtype TCGA-HNSC samples (Padj < 0.05, |logFC| > 1). Prognostic DEGs were screened with coxph P value < 0.001, these genes were displayed in Supplementary Table 3. The risk model was constructed after stepwise coxph analysis with survival package. The information of ten genes in model were summarized in supplementary Table 4

