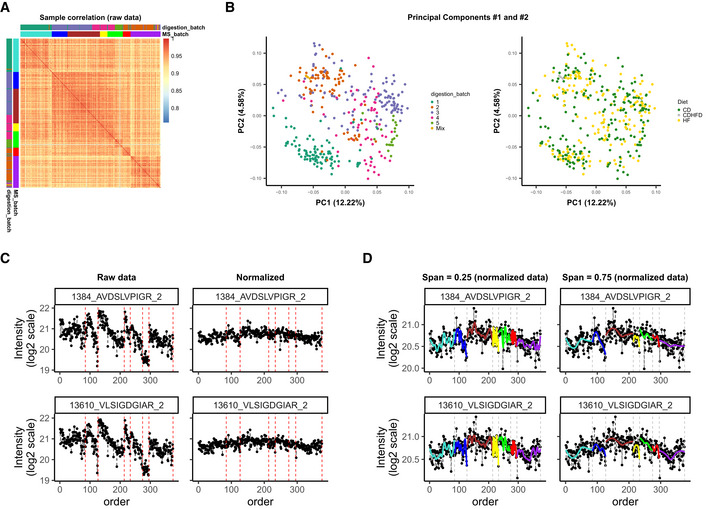
Figure EV1. Batch effects in the Aging mouse study.

(A) Correlation of sample intensities indicates closer relationship between samples from the same batch; (B) Principal Components colored by digestion batch cluster together, but not the samples of mice on the same diet; (C) normalization removes a large fraction of variation, making samples more comparable, this is also seen at the level of individual peptides; (D) when fitting LOESS curve, span has to be chosen carefully: When too small, it will lead to overfitting and overcorrection.
