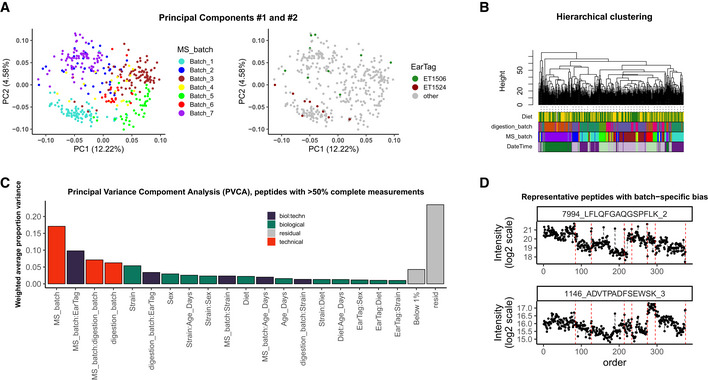
Figure 3. Diagnostics of batch effects: Aging mouse study.

(A) Principal Components #1 and #2 colored by MS batch (left) and replicates (right), percentage of variance in each PC shown in brackets. The effect of clustering by MS batch is dominating, but the replicated samples are closer to each other than just random samples; (B) hierarchical clustering of samples, with leaves colored by diet, digestion batch, MS batch, and date–time of sample acquisition is dominated by technical factors; (C) Principal Variance Component Analysis of peptides, detected in >50% of samples demonstrates, that the technical factors, such as MS batch, digestion batch, and their combination, have a profound effect on the data, while biological factors such as strain, sex, and age account for a much smaller fraction of variance; (D) peptide‐level plots for two iRT peptides demonstrate that batch effect manifests also as MS signal drift that requires correction.
