Figure 4. Batch effects in the TMT mouse study.

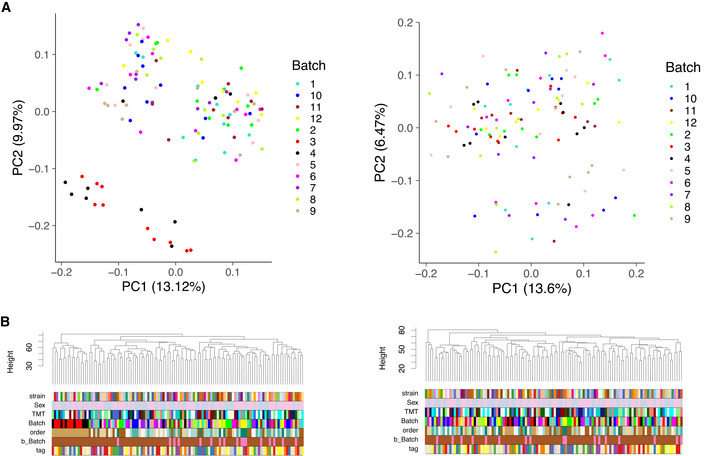
(A) PCA and (B) Hierarchical clustering in matrix of peptides with complete measurements before (left) and after (right) correction.

(A) PCA and (B) Hierarchical clustering in matrix of peptides with complete measurements before (left) and after (right) correction.