
Figure 5. Two‐step correction of batch effects.
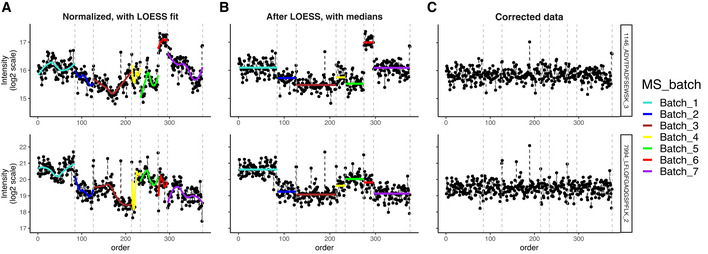
(A) Fitting a LOESS curve for every peptide in each batch and subtracting the fit; (B) using medians for correction of the residual discrete batch effect; (C) the corrected data are more uniform and can now be used for downstream analysis. Data from the Aging mouse study.