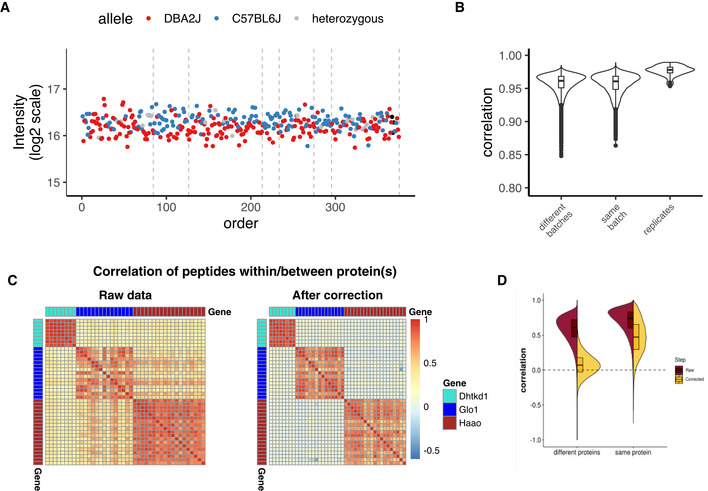
Figure 6. Quality control of batch effect correction.

(A) Representative "Acads" protein QTL that in corrected data demonstrates a clear improvement in allele separation; (B) distribution of sample correlations between batches, within batches, and in replicated samples for corrected data, compare to Fig 2B; (C) heatmaps of peptide correlation for the proteins DHTKD1, GLO1, and HAAO, before and after correction: Correlation is positive for all peptides in the raw matrix, while after batch correction, the correlation of unrelated peptides becomes close to zero; (D) distribution of peptide correlation in raw data (brown) and in batch corrected data (yellow) for peptides from different proteins and peptides from the same protein: While same‐protein peptide correlation is always higher than the correlation of unrelated peptides, the correlation of unrelated peptides approaches zero only after the correction.
