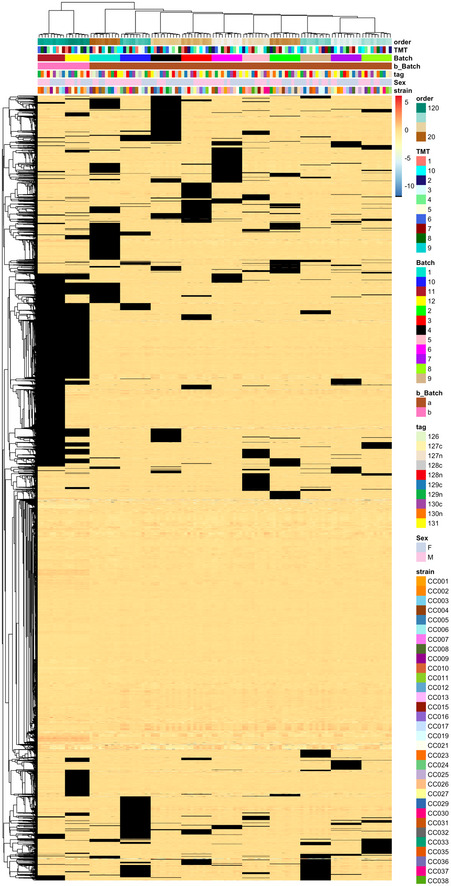
Figure EV6. Missing values in the TMT mouse study.

Heatmap of peptides with up to 30% missing values, filled with minimal values (black) shows that the missing values are primarily associated with TMT batch and this drives the clustering; compare to complete data matrix in Fig 4 in which batches 3 and 4 cluster together.
