-
A
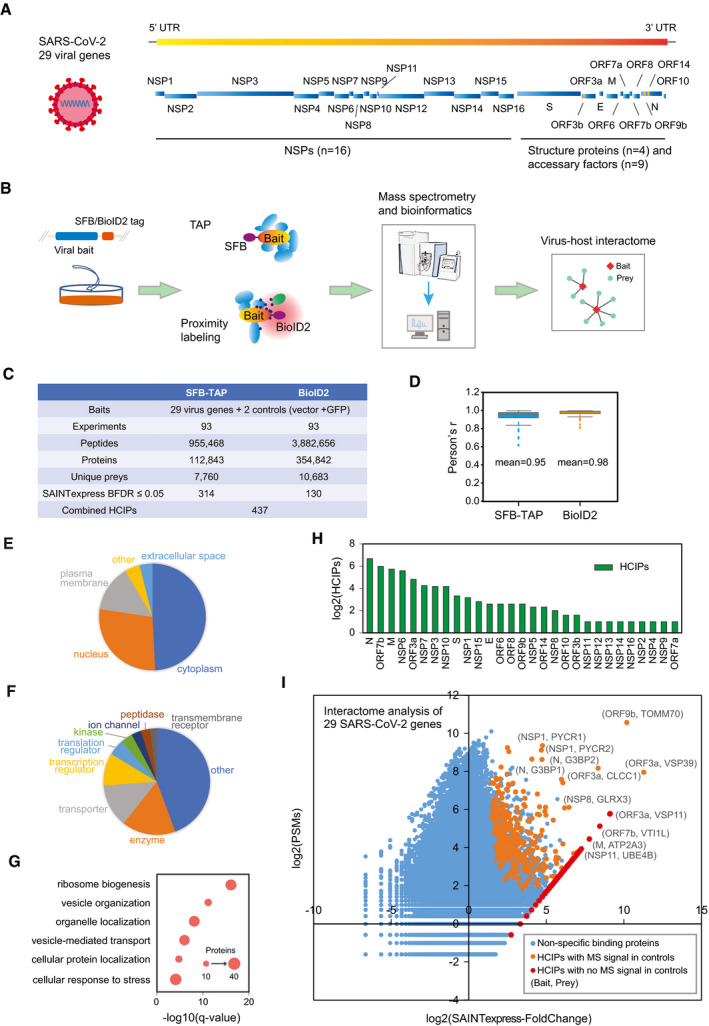
SARS‐CoV‐2 genome annotation, which predicts 29 virus gene products. The 16 non‐structure proteins (NSPs) are cleaved products of the large polyprotein open reading frame (ORF)1ab or ORF1a. These polyproteins are cleaved into small function fragments or NSPs after translation.
-
B
Workflow for the comprehensive virus–host interactome analysis. Two different strategies, SFB‐TAP and BioID2 proximity labeling, were applied in the study. Samples were analyzed by Q Exactive HF mass spectrometry (MS).
-
C
Summary of the datasets obtained from SFB‐TAP and BioID2 results, including the number of high‐confidence interacting proteins (HCIPs). BDFR, Bayesian false discovery rate.
-
D
Pearson correlation coefficient among three independent biological replicates of the SFB‐TAP results and the BioID2 labeling experiments. Box limits represent 25th percentile and 75th percentile; horizontal line represents median. Whiskers display min. to max. values.
-
E–G
GO analysis. GO enrichment was performed using Ingenuity Pathway Analysis. Protein localization (E), molecular function (F), and biological function (G) are plotted in a single panel.
-
H
HCIPs identified in the purification of each SARS‐CoV‐2 gene.
-
I
Correlation between peptide‐spectrum matches (PSMs) of identified proteins and their fold change calculated by SAINTexpress.

