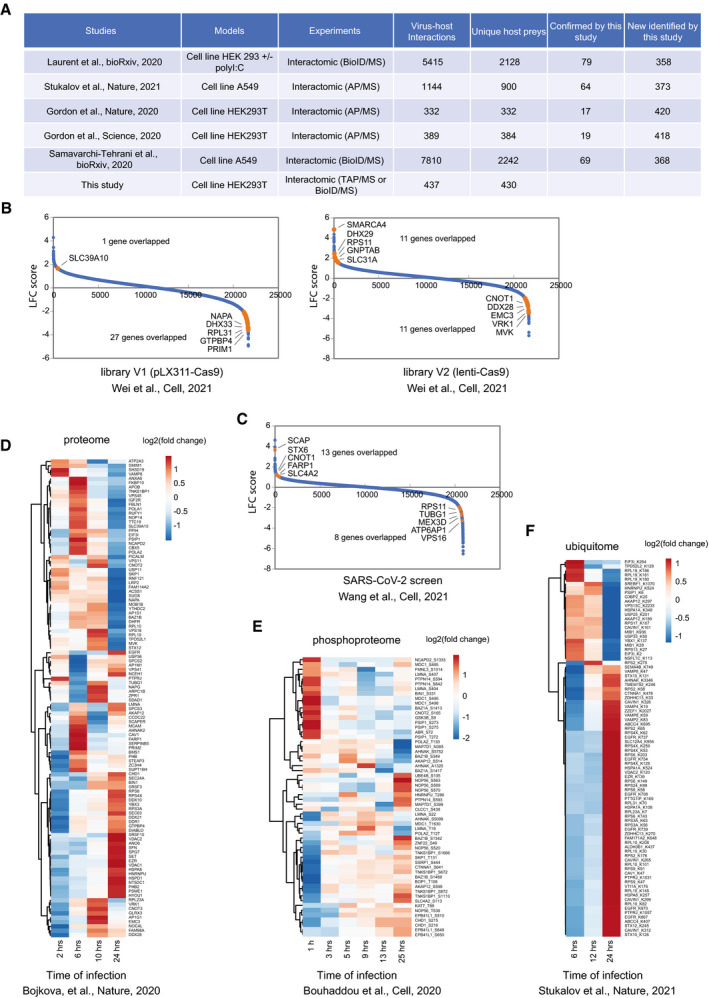
Figure EV2. Comparing HCIPs from this study to other interactome studies with SARS‐CoV‐2 genes or other large‐scale studies analyzing cellular responses upon virus infection (related to Figs 2 and 4).

-
AComparison of HCIPs to other five SARS‐CoV‐2 interactome studies.
-
BComparison of SARS‐CoV‐2 virus–host interaction to the genetic screening with CRISPR technique published by Wei et al in 2021. Two different Cas9 nuclease constructs were used, Lenti‐Cas9‐Blaset (V1) and Plx_311‐Cas9 (V2). Blue dots are the identified genes from the genetic screening. Orange dots are the highlighted overlapped genes between our virus–host interaction study and the results from genetic screening. Up to five top overlapped genes are indicated.
-
CComparison of SARS‐CoV‐2 virus–host interaction to the genetic screening with CRISPR technique published by Wang et al in 2021. Blue dots are the identified genes from the genetic screening. Orange dots are the highlighted overlapped genes between our virus–host interaction study and the results from genetic screening. Top five overlapped genes are indicated.
-
DHeat map of the HCIPs with protein abundance changes during SARS‐CoV‐2 viral infection with the time point of 2, 6, 10, and 24 h.
-
EHeat map of the HCIPs with their phosphorylation levels regulated during SARS‐CoV‐2 viral infection with the monitored time points of 1, 3, 5, 9, 13, and 25 h.
-
FHeat map of the HCIPs with their ubiquitination levels regulated during SARS‐CoV‐2 viral infection with the monitored time points of 6, 12, and 24 h.
